Mobile BI solution: functionality, top 3 tools, benefits, and best practices
August 3, 2023
- Home
- Business intelligence services
- Mobile BI solution

by Sergey Sinkevich,
Head of BI Practice & BI Solution Architect
Today’s business world relies heavily on quick decision-making, so many companies have already adopted BI services and are expanding their capabilities with mobile BI. Let’s explore what purpose mobile BI solutions serve, their key capabilities and top platforms, and what difference they can make for a company.
Table of contents
Mobile business intelligence market stats
$61.15 bn
is the projected mobile BI market size in 2030
Market Research Future
The US & China
are the two largest mobile BI markets
Research and Markets
Scheme title: Mobile Business Intelligence Market Size
Data source: Mordor Intelligence
Study period
2018 – 2028
Fastest growing market
Asia Pacific
Largest market
North America
Major players
Common features of mobile BI solutions
Data delivery
- Scheduled (time-based, event-based, etc.) data delivery for different types of users via mobile-optimized reports and dashboards, alerts, notifications, and emails
- Instant personalized notifications and alerts on important changes to key performance indicators, anomalies, or goal achievement
- Interaction with reports and dashboards via intuitive gestures (drilling down and up, sorting, filtering, zooming in and out, data hiding)
- Self-service report creation with drag-and-drop functionality, filters, or NLP
- Rich data visualization capabilities, including charts, pivot tables, KPI widgets, summary/tabular views, and dashboards
- Storytelling capabilities
- Content search
Collaboration
- Report distribution to groups or individual users on a schedule or based on business-defined rules
- Messages and comments customization according to the recipient’s user role
- Content (tiles, reports, or visuals) commenting, annotation, and sharing
- Interaction with data through discussions, commenting, or clapping
- Automated notifications about new posts, questions, comments, or replies via push notifications or emails
- BI content embedding (portals, intranets, blogs, web applications, and websites)
Native device functionality
- Access to BI content from different devices
- Offline mode (proactive automated caching and offline editing)
- Uploading files from a mobile device, including audio, videos, QR-codes, or barcodes
- Mobile touch control
- Real-time push notifications and alerts to the home screen about a particular analytics pattern or trend
- GPS integration
Analytics
- Data analysis from different points of view with drill-down, drill-through, and slice-and-dice capabilities
- Predictive modeling for foreseeing business scenarios and patterns
- What-if analysis for simulating complex scenarios and finding optimal business outcomes
- Geospatial analytics
- Augmented analytics
- Real-time data analytics
Data preparation and management
- Pre-built data source connectors to heterogeneous sources, including databases, business applications, flat files, Excel files, feeds, and web URLs
- Universal APIs for building custom integrations to get data from any cloud or on-premises system
- Data transformation and quality management (validation, cleansing, deduplication, enrichment) enabled by ETL/ELT processes
Data storage
- Storing business data in a relational, columnar, and multi-dimensional format
- Consolidating company-wide data in an enterprise data warehouse
- Housing business line-specific data in data marts for particular user groups
- Pre-built integrations with a data lake
- Accompanying analytics data stores with an operational data store for operational and high-volume business data analysis and reporting
- Housing metadata in data catalogs, business glossaries, dictionaries, etc.
Data governance and security
- Multi-factor authentication (user passwords, device ID, biometrics)
- Data encryption in transit and at rest
- Ability to prohibit particular data from downloading
- Fine-grained access control with specific options (read-only, read-write, report authoring, drill-down, or export)
- Data encryption and data masking
- Sensitive data labeling
- User activity and access log
Make quick on-the-go business decisions with mobile BI
Mobile BI access methods
Here are three common ways for end-users to access business intelligence capabilities via portable devices:
Definition
Differentiators
Limitations
Native mobile BI applications
Definition
Differentiators
Limitations
Hybrid mobile BI applications
Definition
Differentiators
Limitations
Best BI tools with mobile capabilities on the market
Scheme title: 2022 Gartner Magic Quadrant for Analytics and Business Intelligence Platforms
Data source: Gartner, 2022
Mobile-specific functionality
Native mobile apps for Windows, iOS, and Android
Authoring reports for mobile users with Power BI Desktop and the Power BI service
Annotating and sharing snapshots of tiles, reports, or visuals with colleagues and customers from the app
Sharing links from the app to view reports and dashboards (Power BI Pro and Premium Per User license)
Push notifications about personal data alerts, new shared dashboards, changes to group workspace, Power BI events and meetings
Location-based report filtering
Barcode and QR-code scanning for Power BI data and reports
Data access in the offline mode and background data refresh
Mobile formatting options for visuals in a mobile-optimized layout
Natural language querying
Data security with Microsoft Intune
Pricing
Power BI Desktop
free
Power BI Pro
$9.99 per user/month
Power BI Premium
$20 per user/month or $4,995 per capacity/month with an annual subscription and an unlimited number of users
Power BI Embedded
from $1.0081/hour
Free 2-month trial

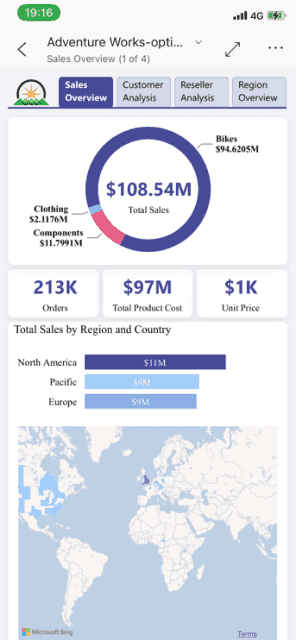
Example of Power BI Mobile app UI
Data source: learn.microsoft.com — About mobile-optimized Power BI reports
Mobile-specific functionality
Available for Android and iOS as an add-on for Tableau Cloud and Tableau Server
Automatic creation of dashboard layouts optimized for mobile devices
Interactive previews caching for offline access and work
Content filtering based on the viewer’s credentials
Automated notifications about shared content, comment mentions, and status updates for the owned content
Notifications via emails, in-app notifications center, or Tableau for Slack app
Personalized content recommendations based on viewing habits
Search capabilities (results sorted by projects, workbooks, views, and business metrics)
Vast sharing options, including sending links via third-party apps
Support for a variety of authentication methods, including SAML, OpenID Connect, Mutual SSL, VPN or reverse Proxy, MDM with AppConfig, and MAM
Content access permission configurations using Tableau Cloud or Tableau Server in a desktop browser
Pricing
Tableau Creator
$70/user/month
Tableau Explorer
$35/user/month (fully hosted by Tableau)
Tableau Explorer
$42/user/month (on-premises or public cloud)
Tableau Viewer
$12/user/month (fully hosted by Tableau)
Tableau Viewer
$15/user/month (on-premises or public cloud)
Free 14-day trial

Example of Tableau mobile app UI
Data source: help.tableau.com — Explore Content on Tableau Mobile
Mobile-specific functionality
Available through a web-based client in mobile browsers and the fully native, optimized Qlik Sense Mobile app
Intelligent layout adjustment, including charts resizing, data detail rescaling, and optimizing visualizations
Alerts through push notifications on any data change
Content sharing via email, WhatsApp, file storage, social media, and others
Interactive online and offline exploration
Natural language search
Pricing
Qlik Sense Business
$30/user/month
Qlik Sense Enterprise SaaS
custom pricing is available upon direct request
Free 30-day trial


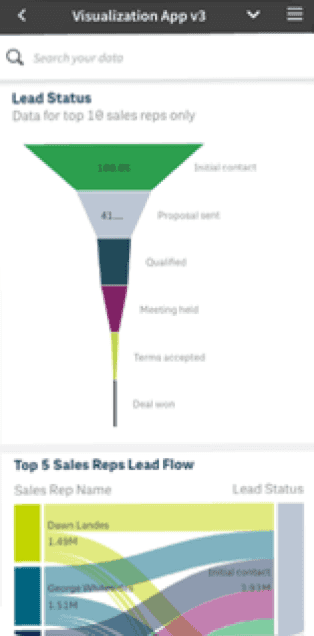
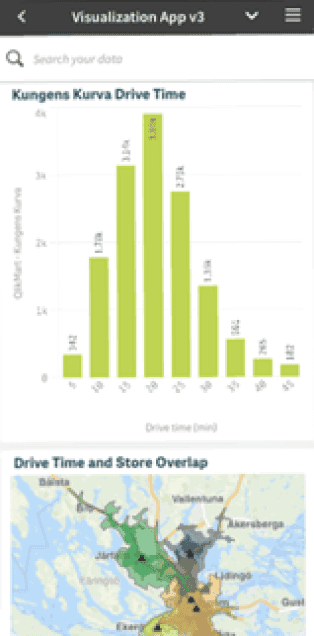
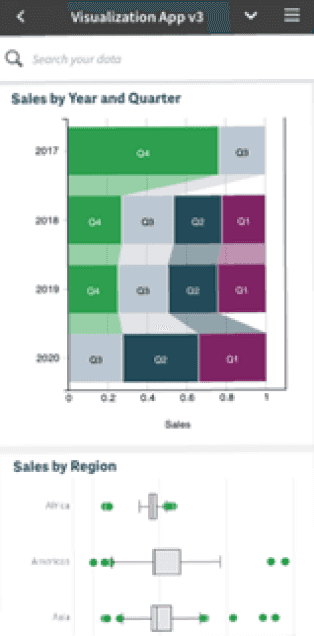
Example of Qlik mobile app UI
Data source: qlik.com — Mobile Analytics | Qlik Sense®
Mobile BI benefits
The highest value of business intelligence is the support of data-driven decisions. Mobile BI capabilities, in turn, can bring the same benefits and beyond, such as:
Improved efficiency of work
Mobile BI users can instantly access specific information to make timely decisions and accomplish their daily tasks on time even if they are away from their computers.
Enhanced user experience
Mobile devices are easy to carry around and do not limit users to a particular location, which makes mobile BI a very user-friendly option. Native device functionality also enables a truly interactive user experience.
Improved collaboration
Mobile BI features encourage end-users to collaborate and brainstorm new ideas, such as new content, instant notifications and alerts, comments and reactions, secure content sharing, in-app discussions, and user activity tracking.
Increased data democratization
Mobile BI allows more employees to access data and analytics capabilities to handle information properly and maximize its value. In the long run, increased BI adoption rates accelerate digital transformation and help the company stay competitive.
Looking for a trustworthy mobile BI vendor?
Mobile BI challenges
Mobile devices can be lost or stolen, exposing sensitive business data.
Data security risks
Mobile devices can be lost or stolen, exposing sensitive business data.
Data security risks
When a device is stolen or lost, the IT department should be able to block the owner's access to all corporate accounts and sensitive data. Companies adopting mobile BI also need to redefine all existing data security practices and policies. Some other features that could help safeguard data are:
- Screen capture blocking
- Clipboard access control
- Configurable data caching
- Detection of jailbroken devices
If a mobile app’s interface isn’t intuitive and easy to use, negative user experience can lead to employee resistance and sabotage.
Poor user interface design
If a mobile app’s interface isn’t intuitive and easy to use, negative user experience can lead to employee resistance and sabotage.
Poor user interface design
It’s crucial for mobile BI providers to keep user experience aligned with the latest mobile app trends, because modern users are accustomed to the polished interfaces of consumer mobile apps and expect the same experience in a mobile BI solution. The following recommendation can help deliver the expected user experience:
- Make user interface self-explanatory (e.g. an app can provide explanations and hints to help users with a certain task)
- Employ functionality common in native apps and familiar to most users, like swiping, pinching, or double-tapping
- Enable users to collaborate with colleagues and customers via email, internal platforms, or social media
- Monitor use adoption, including the most and least used features and user behavior patterns
Lacking value for target users, mobile BI can eventually become just a tool for reconfiguring desktop reports and dashboards for handheld devices.
Failing to cater to unique user needs
Lacking value for target users, mobile BI can eventually become just a tool for reconfiguring desktop reports and dashboards for handheld devices.
Failing to cater to unique user needs
Start with examining the needs of workers predominantly using mobile devices and PCs and creating the functionality most needed by each user group. For example, your employees can prefer to input text with a physical keyboard, run complex analysis on big screens, and switch between windows with a mouse, but use their mobile devices to upload video and audio files. This analysis will lay the groundwork for your mobile BI strategy and change management planning.
Decision-making from anywhere with mobile BI
Mobile business intelligence is among the most prospective trends in data analytics. With mobile computing so mature and affordable, mobile BI will evolve at an even more accelerated pace. With proper preparation and an experienced BI partner like Itransition, you can build a truly-effective mobile business intelligence solution.

Insights
BI implementation: a comprehensive roadmap & best practices
Learn what BI implementation entails, including key steps and benefits, along with BI challenges and their solutions to effectively generate insights from data.

Insights
Business intelligence architecture: key components, benefits & tools
Learn about the components of BI architecture and their contents. Explore top software to implement BI architecture and how to overcome its adoption challenges.

Case study
BI platform with AI and computer vision for a fashion retailer
Learn how Itransition delivered retail BI and deployed an ML-based customer analytics solution now processing 10TB of data.

Case study
Pharmaceutical data analytics suite for a US multinational
Read about Itransition’s 10+ years long cooperation with a US-based multinational to create their flagship pharmaceutical data analytics products.

Insights
Business intelligence in the retail sector: main use cases, benefits & platforms
Discover how your retail company can benefit from business intelligence software by exploring its key features, common integrations, and best platforms.

Insights
Business intelligence for finance: capabilities, tools & integrations
Explore how business intelligence and data analytics benefit the financial services sector and learn what capabilities, integrations, and tools make up a successful BI strategy.
More about BI services
Services
Insights
Industries