Services
SERVICES
SOLUTIONS
TECHNOLOGIES
Industries
Insights
TRENDING TOPICS
INDUSTRY-RELATED TOPICS
OUR EXPERTS

September 16, 2025
Scheme title: Solutions manufacturing companies use to understand their data
Data source: Tech-Clarity
Scheme title: Benefits of analytics for manufacturers
Data source: Tech-Clarity
of plant owners believe real-time analytics is critical to staying competitive
of manufacturers consider data analytics as a top investment priority
rise in production output reported by smart manufacturing adopters
average reduction in energy consumption achieved by leading Lighthouse manufacturers through advanced analytics
Dive into a demo video prepared by our BI experts to understand how Power BI manufacturing dashboards can facilitate the decision-making process for both high-level executives and production line workers.
Manufacturing businesses generate vast amounts of structured and unstructured data scattered across disparate systems and left underutilized due to the difficulty of unifying and interpreting it. Power BI dashboards help overcome this issue by turning raw data into actionable insights and equipping decision-makers, from top-tier executives to shop floor managers, with manufacturing analytics insights to optimize operational efficiency and reduce waste. Here are Power BI manufacturing dashboard examples we can develop for different use cases in the manufacturing industry.
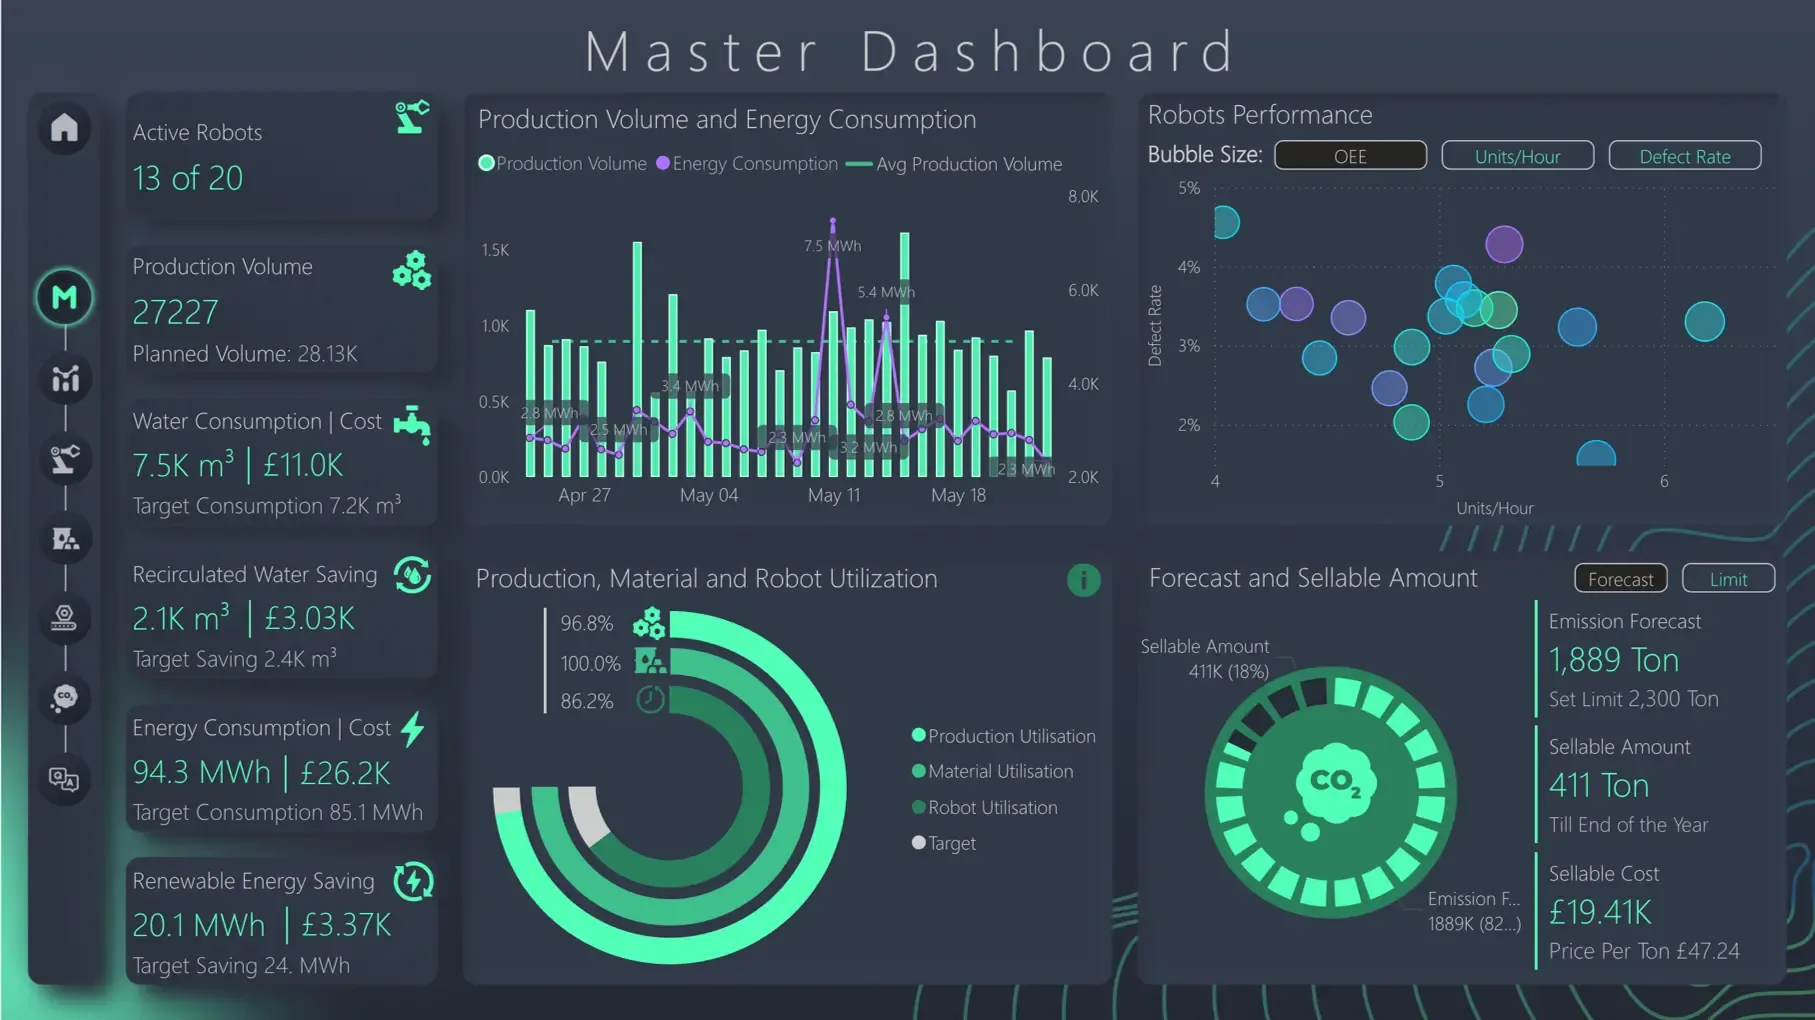
A master dashboard that integrates and structures data from different solutions, such as ERP, energy and water management systems, and MES, offers top-level decision-makers a comprehensive, strategic view of all manufacturing operations. Within a single dashboard, they can accurately monitor high-level KPIs, such as production volumes, resource consumption, production utilization, and total emissions, to quickly assess the overall health of manufacturing processes, as well as drill down into underlying data to identify production bottlenecks and their root causes.
Intended users:

Custom-built KPI dashboards for plant and operations managers serve as an essential tool for quality control, helping teams identify and fix issues that negatively affect the bottom line. These dashboards enable monitoring of production volumes, product defect rates, resource consumption, and other key performance indicators, as well as visualizing monthly trends and associated costs. Users can also filter data by time frame, production unit, shift, material type, or robot manufacturer to spot specific areas of inefficiency and gain actionable insights for process improvement.
Intended users:
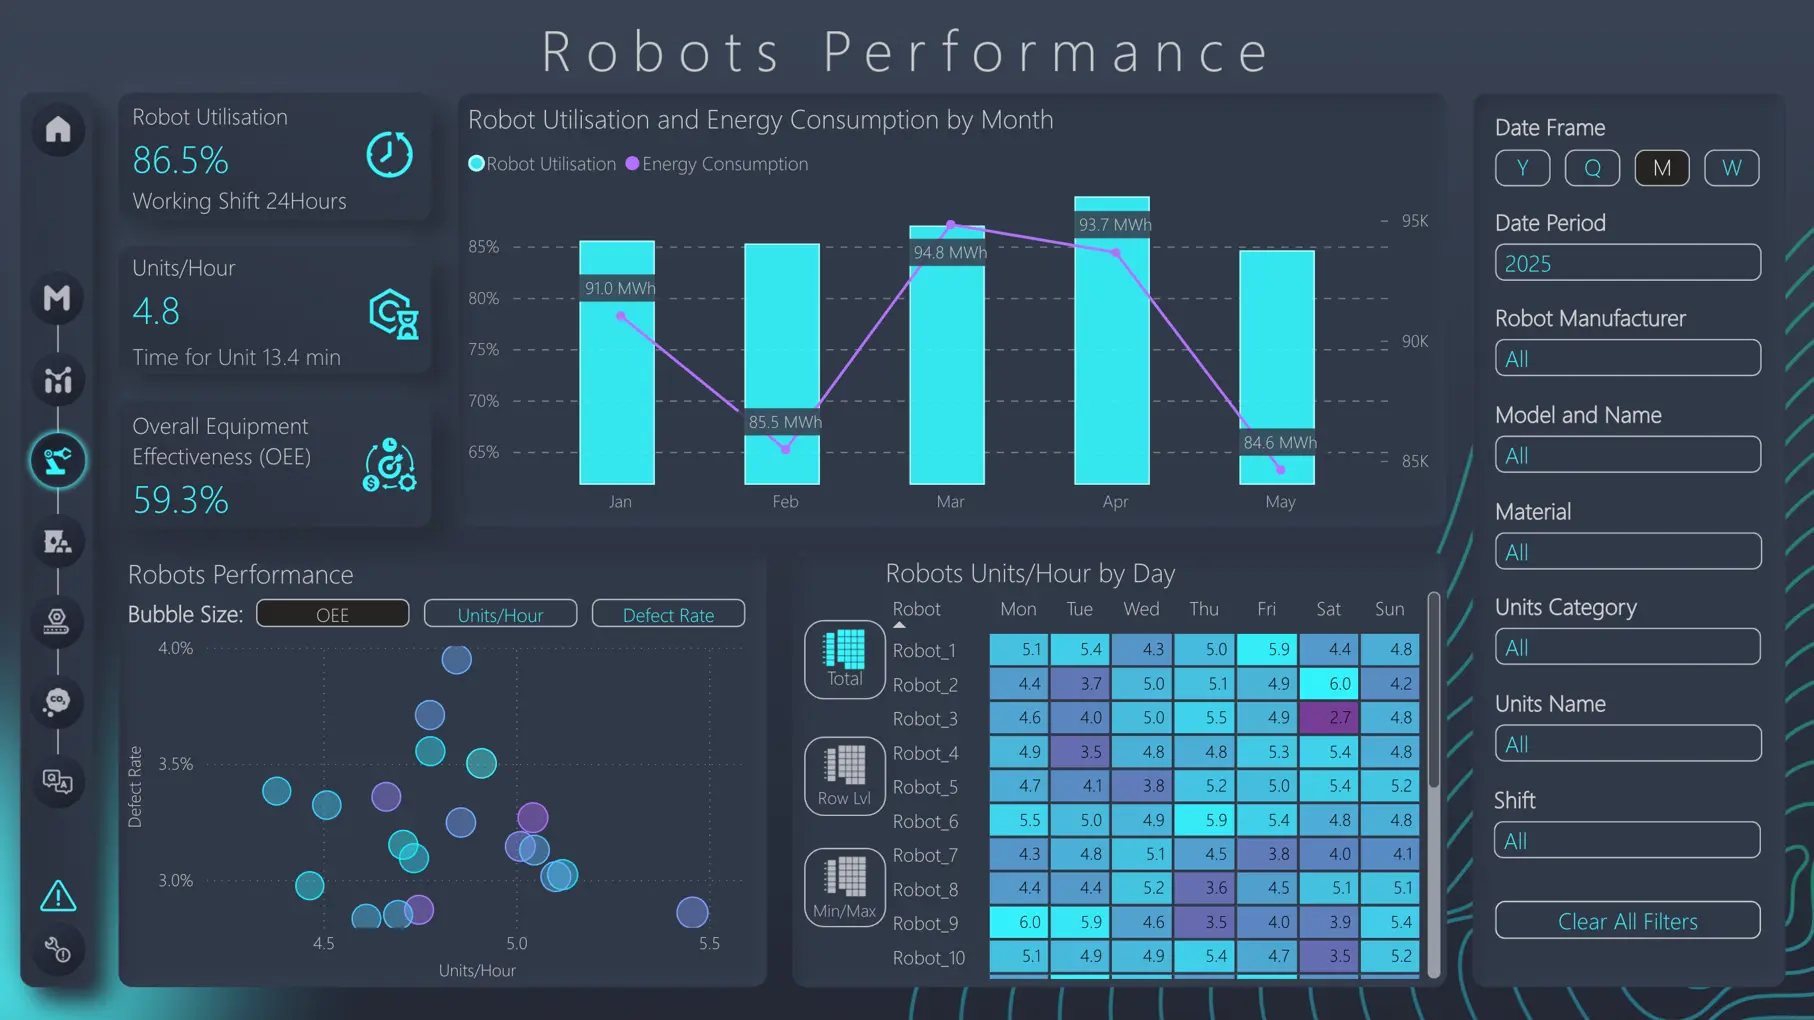
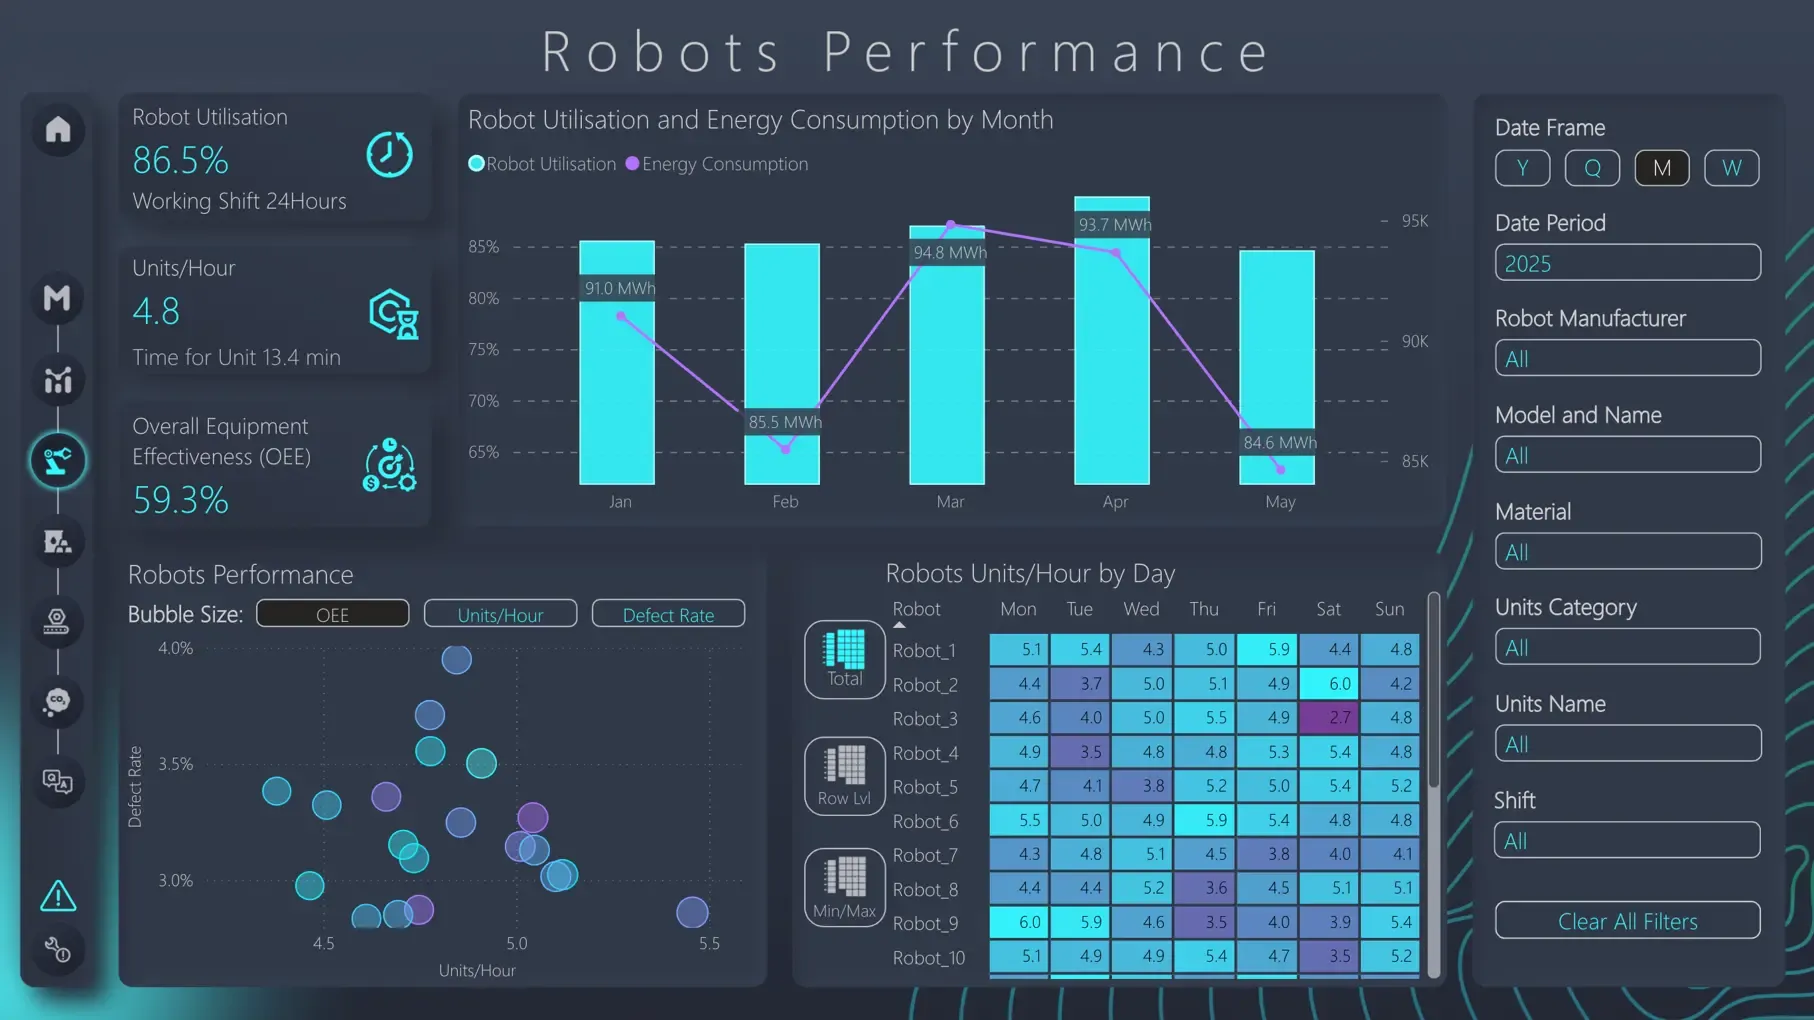
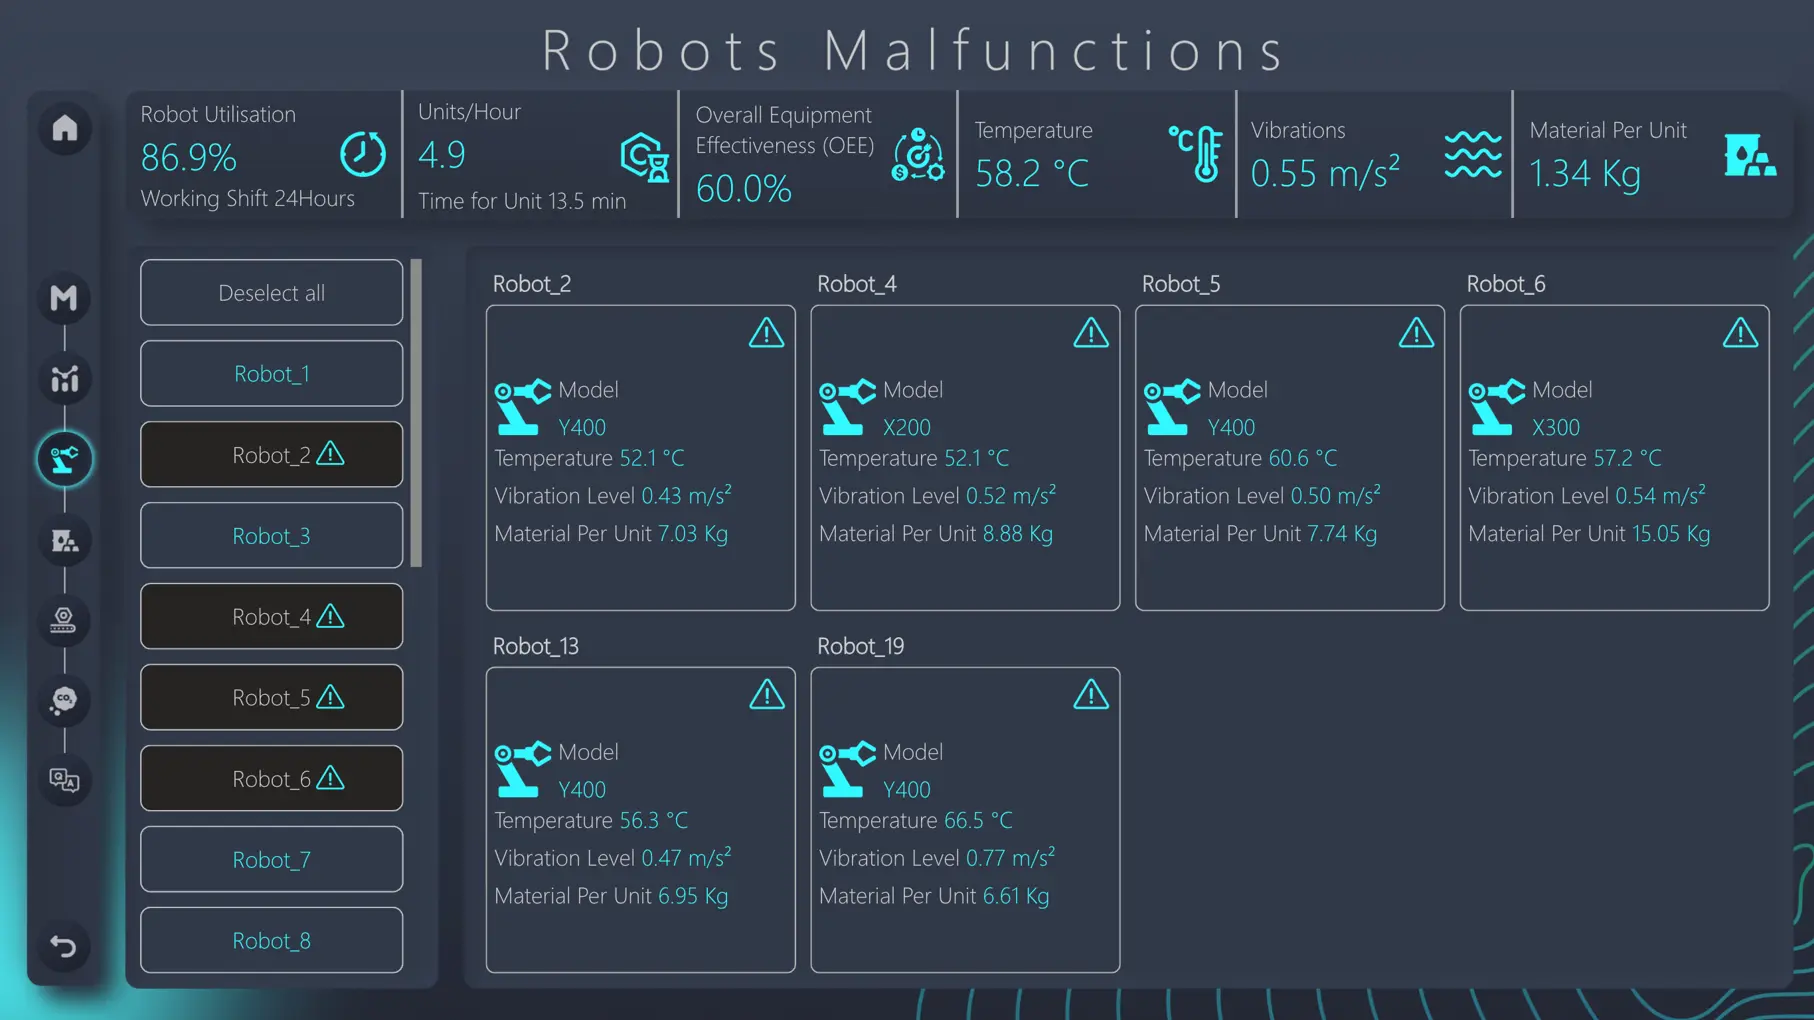
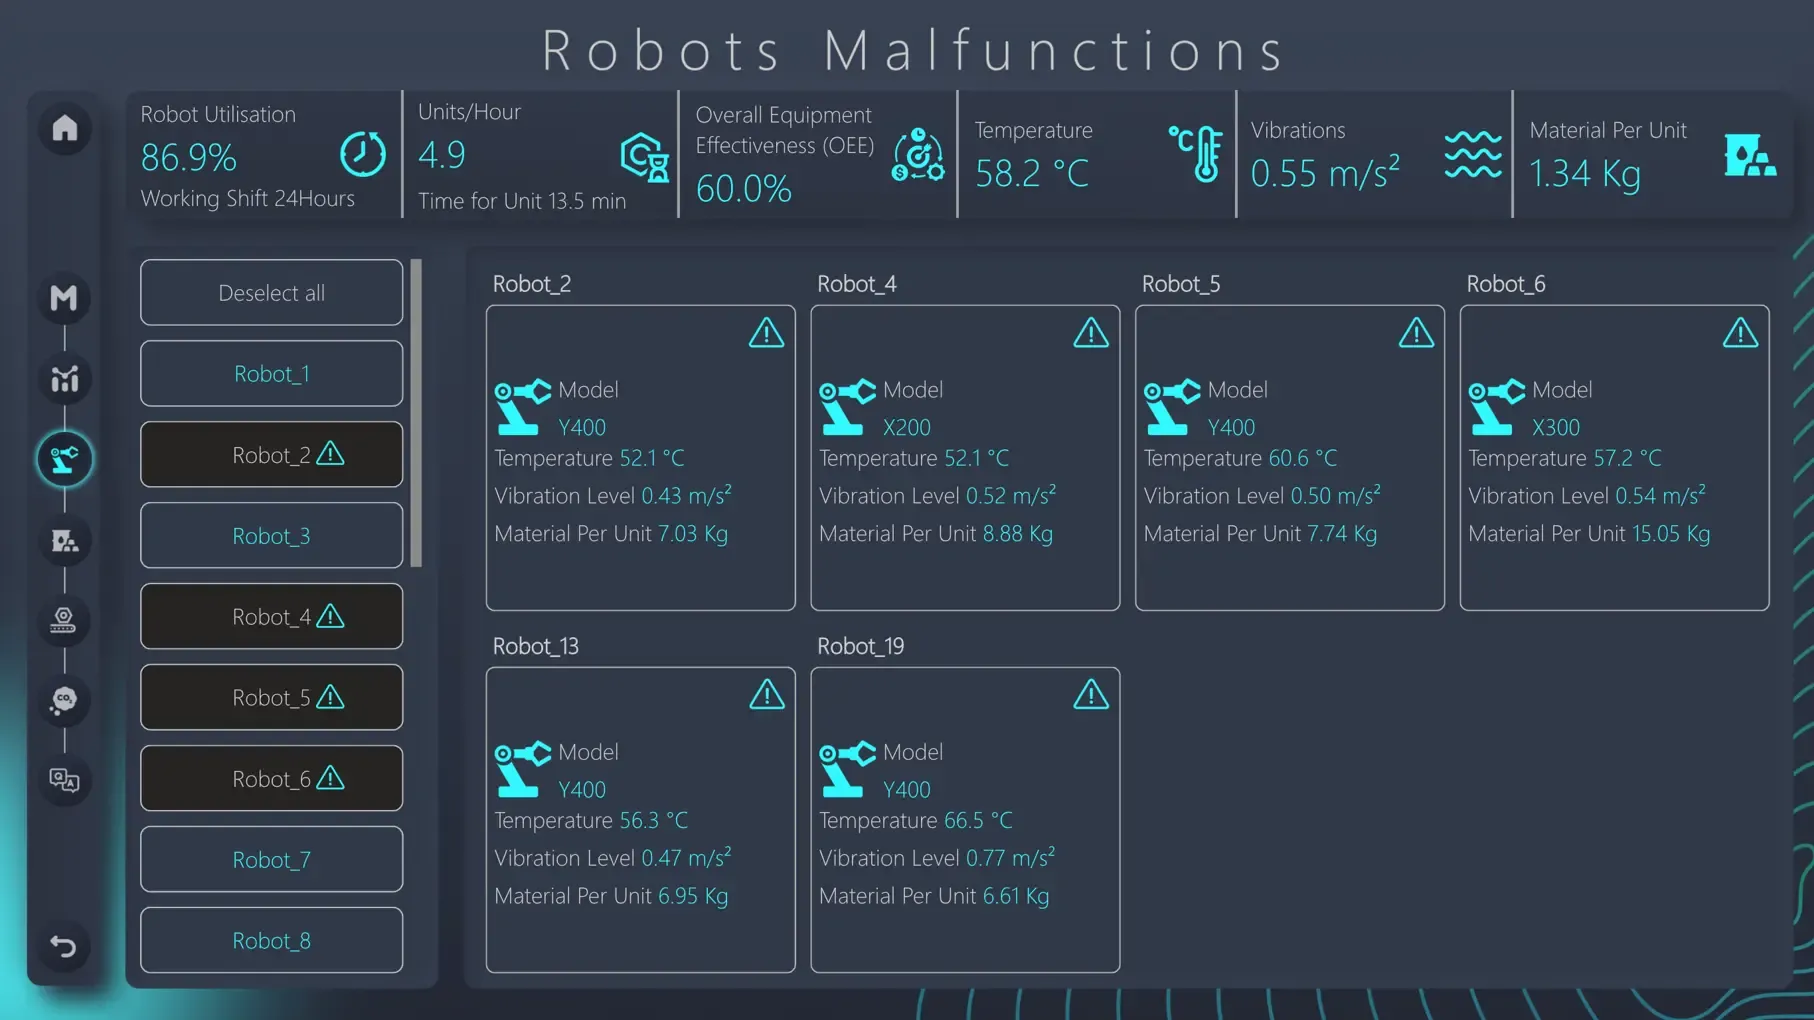
Being integrated with MES, machine monitoring tools, and energy monitoring systems, a robot performance dashboard becomes an actionable, intelligence-driven control panel. The dashboard provides frontline teams with complete visibility into each robot’s performance, including utilization, overall equipment effectiveness, temperature and vibration metrics, and energy consumption. Besides real-time monitoring of robot health, maintenance crews can use Power BI robot intelligence dashboards augmented with AI capabilities to spot early malfunctions, such as overheating, to optimize robot utilization or schedule maintenance accordingly.
Intended users:
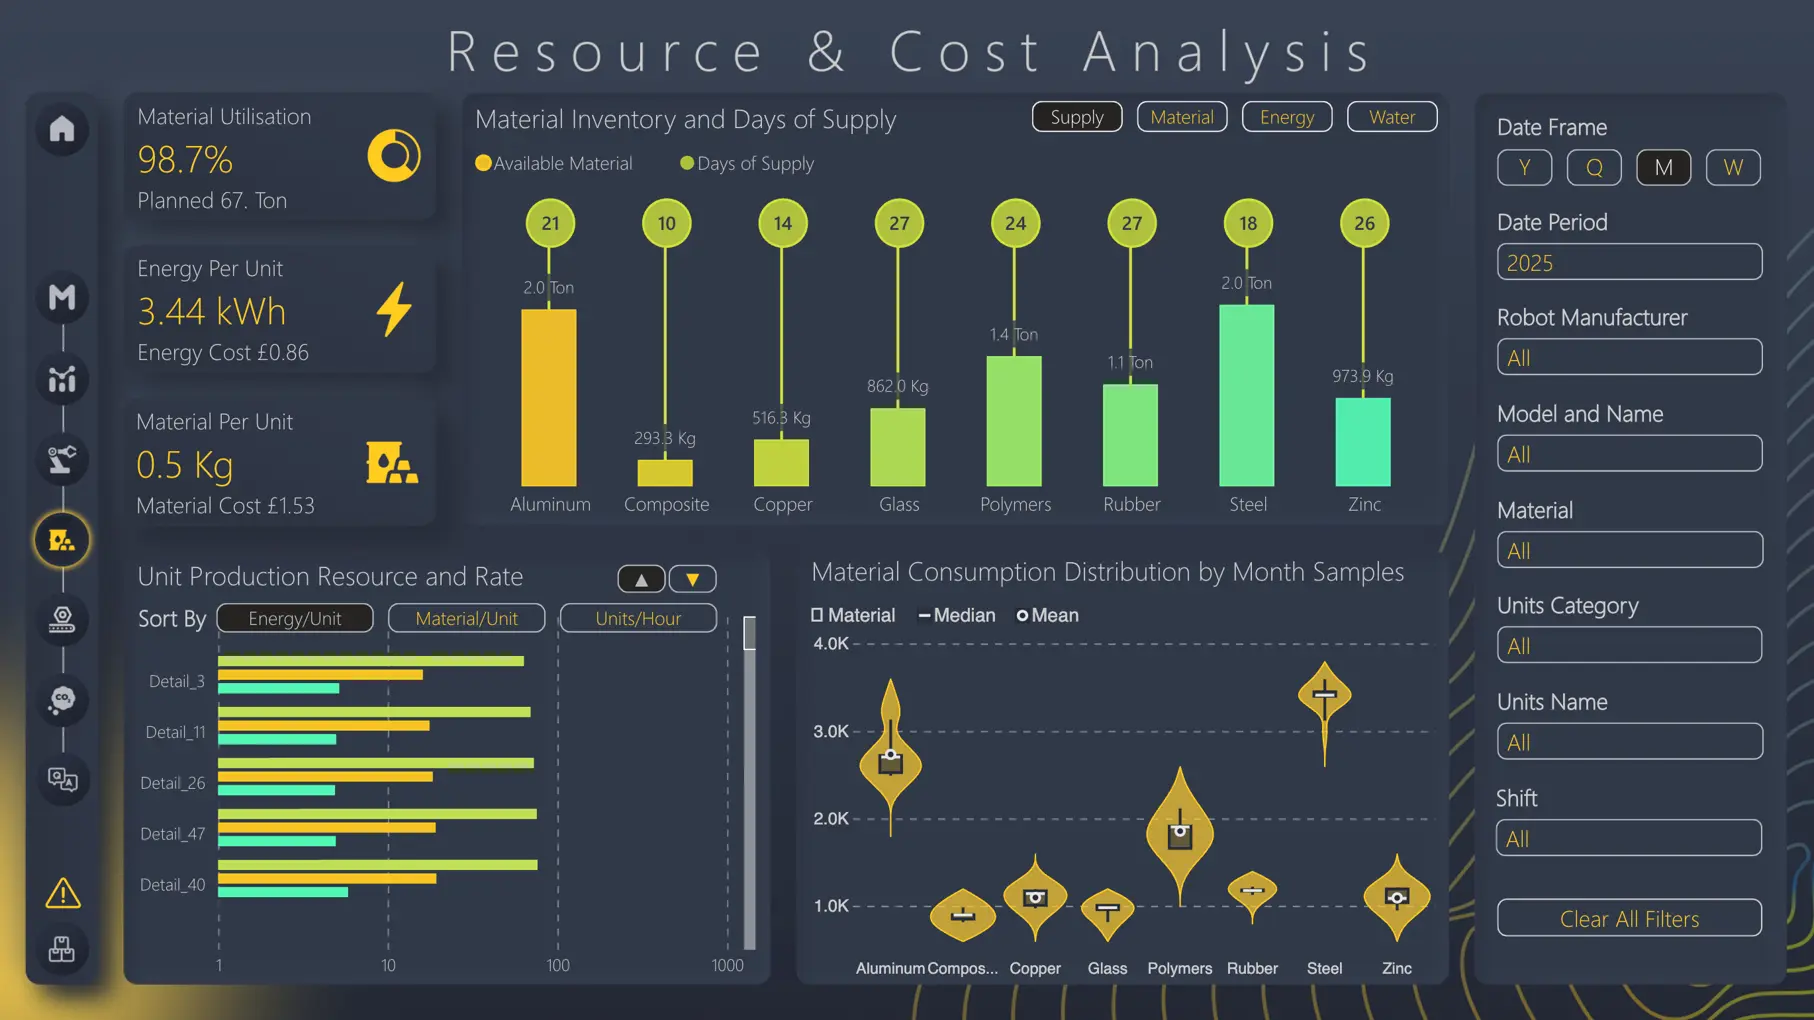
Power BI manufacturing dashboards bring together data from siloed sources, including ERP, inventory management, and procurement systems, to analyze material inventory and utilization, production resource rates, monthly consumption patterns, and resource consumption by unit. Equipped with insights into material availability and usage, finance, procurement, and operations teams can compare unit efficiency. In addition, this data visualization tool features artificial intelligence capabilities to predict unit-level material and energy demand, forecast material costs, identify material supply risks, and provide actionable suggestions for smarter sourcing decisions that reduce shortages and cost overruns.
Intended users:

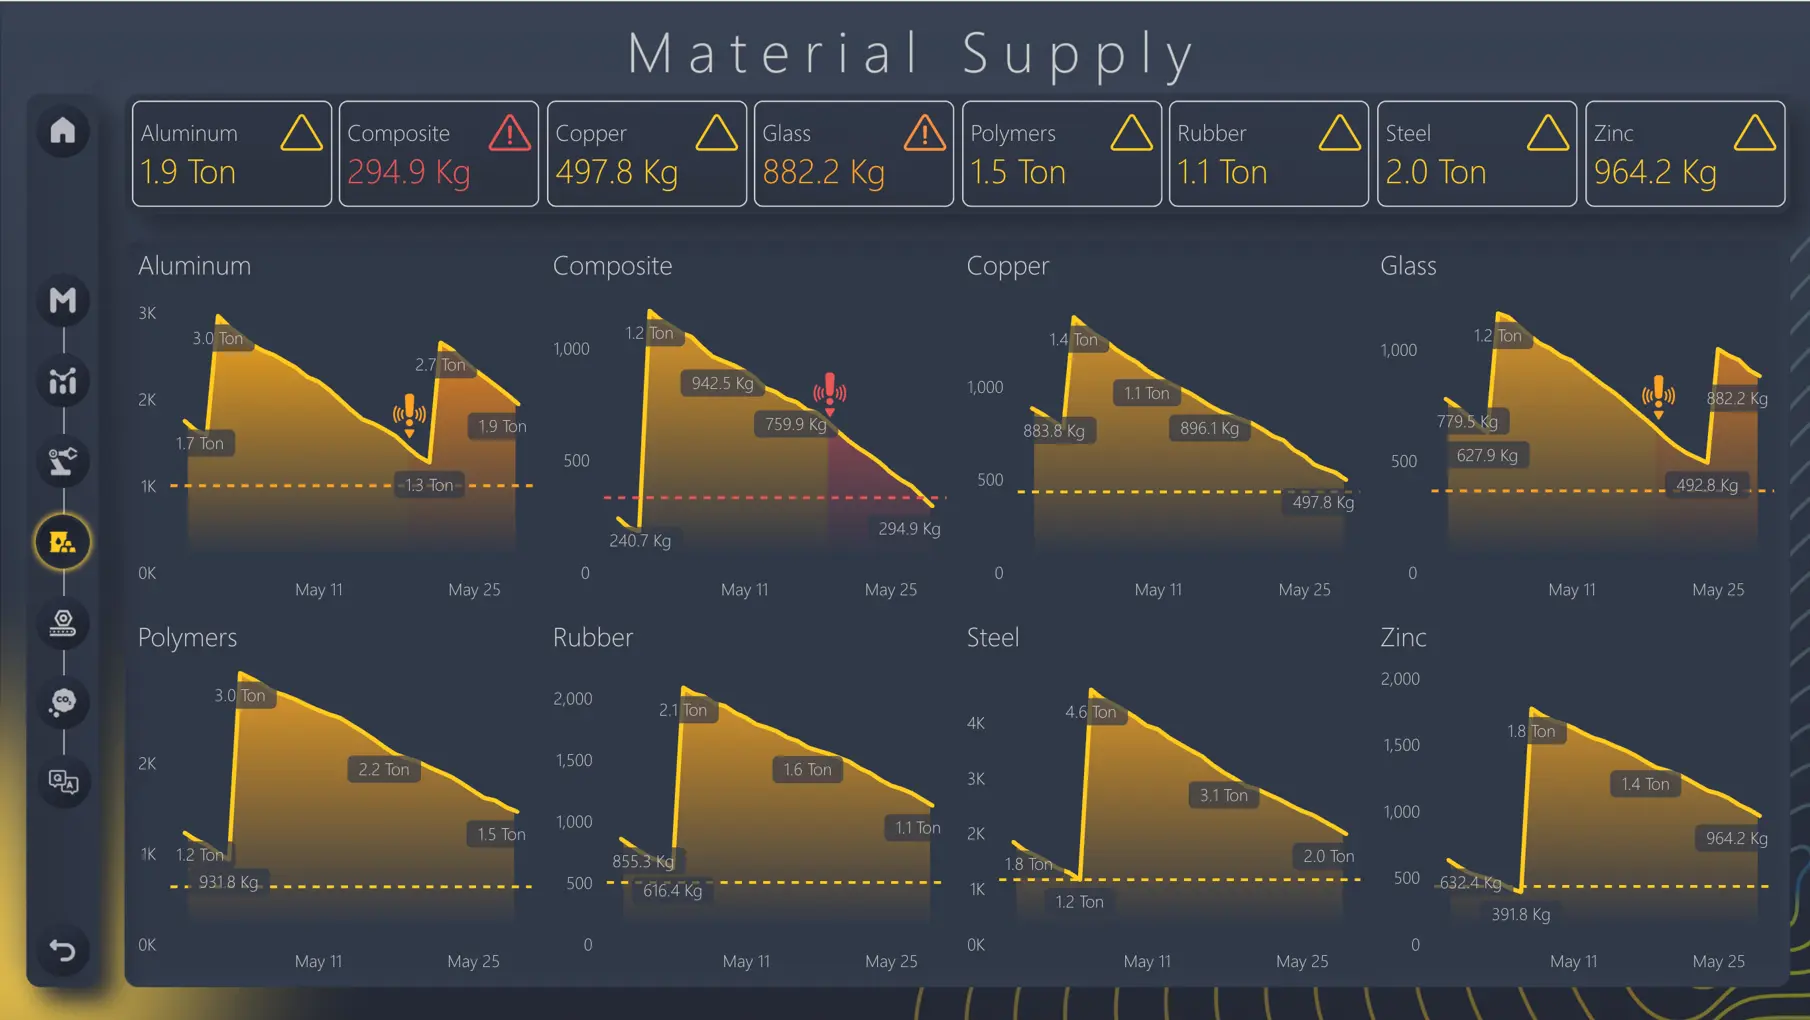
In addition to having a unified view of material inventory, procurement, supply chain, and production teams need the ability to drill down into individual material categories. With Power BI-based dashboards, manufacturers can track resource availability in real time, analyze historical material usage trends, and quickly identify critically low material levels. By providing a nuanced overview of material supply and generating notifications about potential shortages, this live intelligence console helps specialists plan inventory proactively and prevent production disruptions.
Intended users:

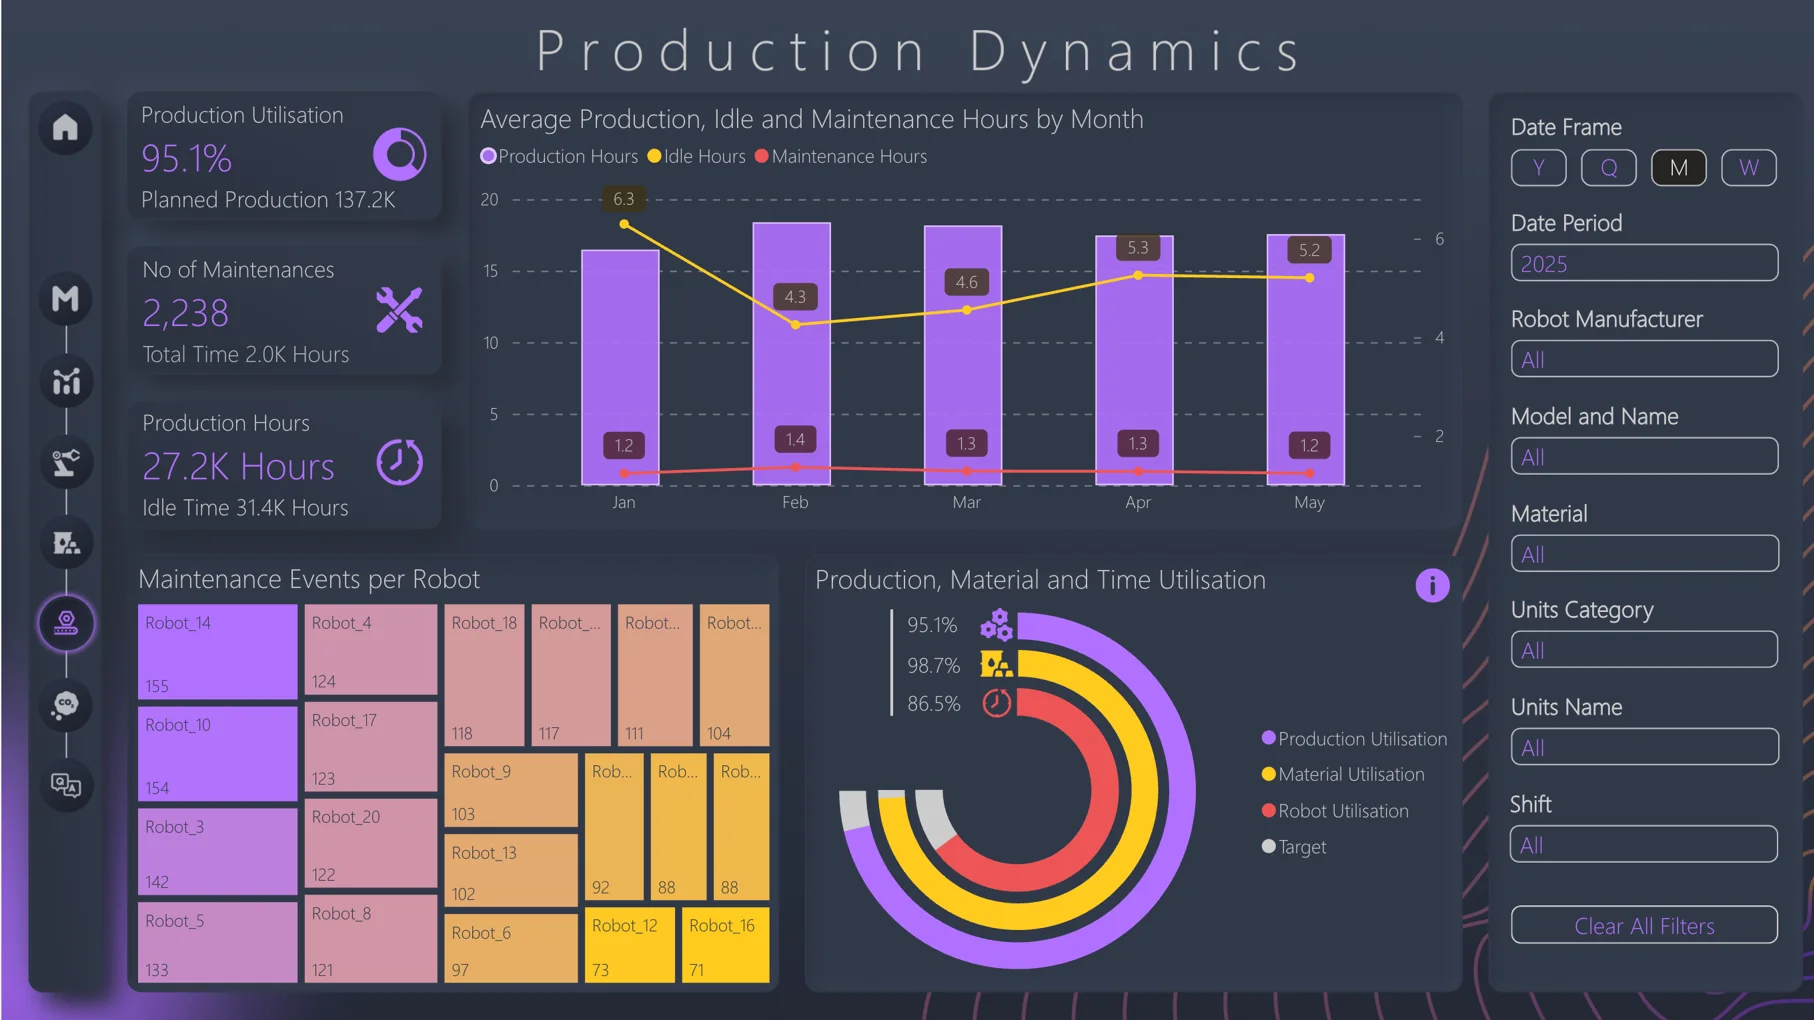
A production dynamics dashboard that ingests data from MES, maintenance systems, and shift reports provides manufacturers with a clear breakdown of production performance, including production hours and utilization, equipment downtime, maintenance frequency and duration, and material consumption. Beyond the baseline metrics, the dashboard also delivers real-time insights into lost hours, idle time, robot reliability, and overall capacity utilization, enabling operations teams to improve shift planning, maintenance scheduling, and resource allocation.
Intended users:

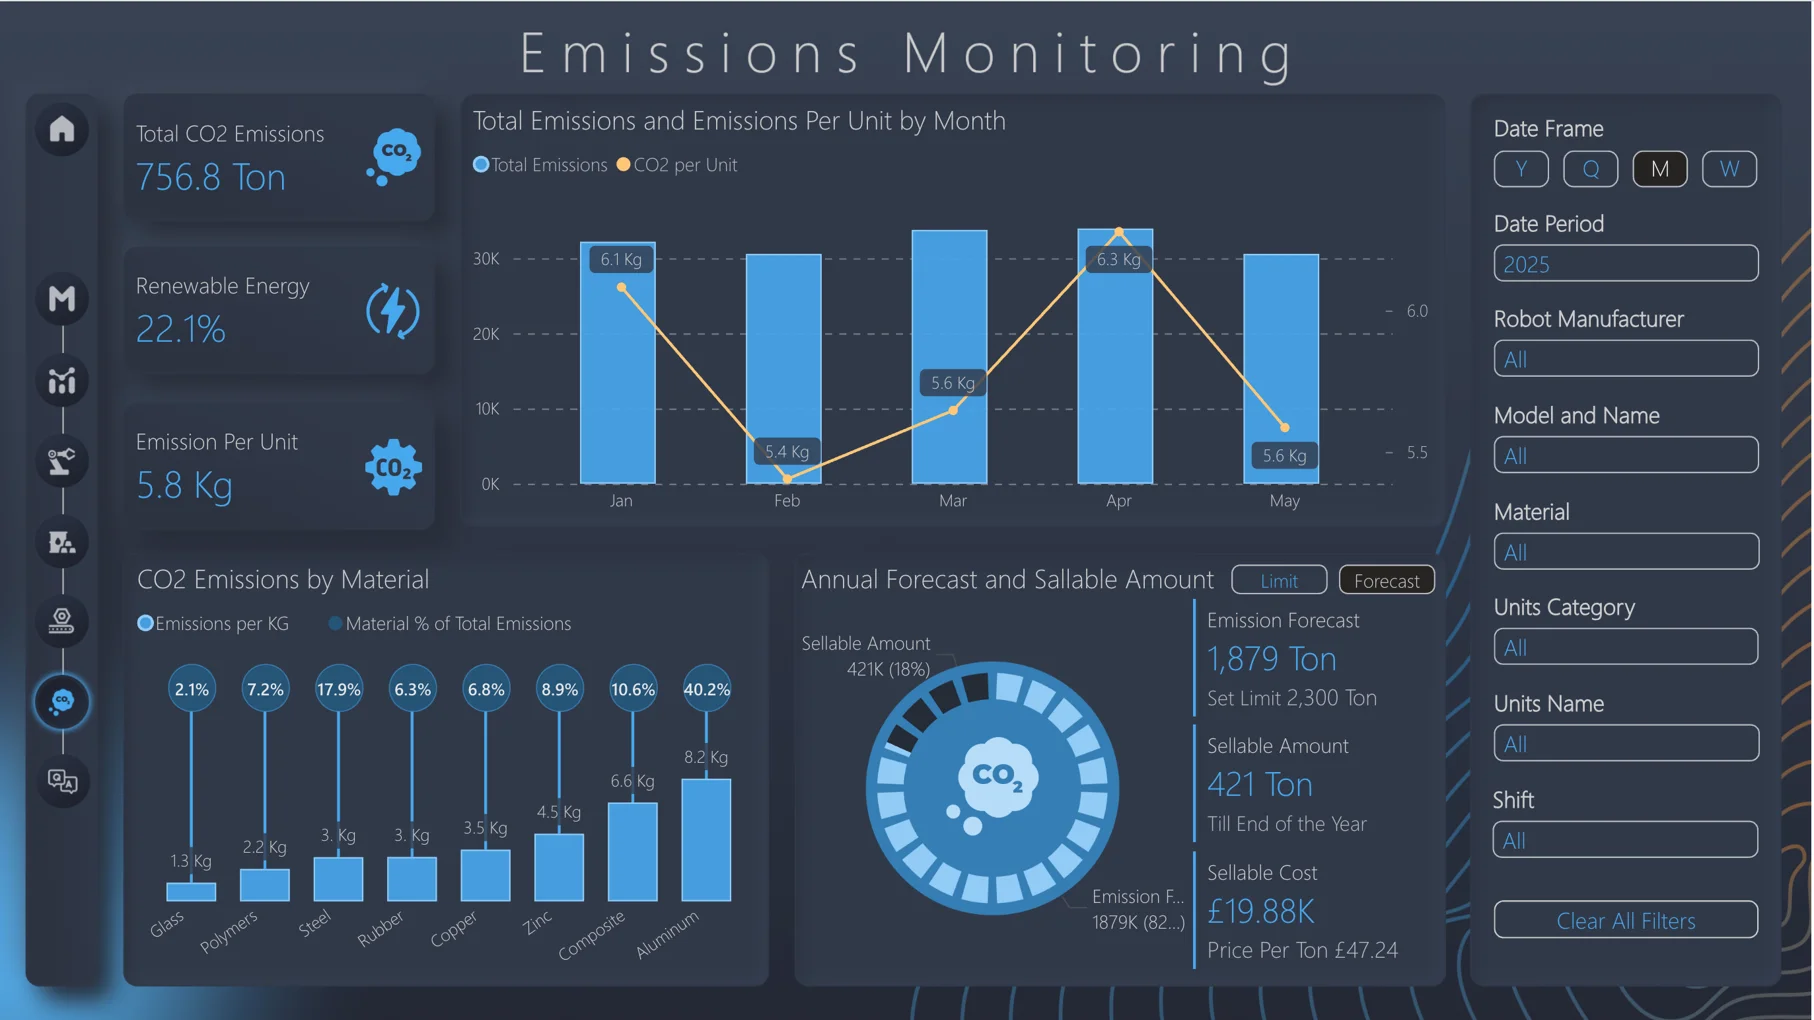
Tailored emissions monitoring dashboards give manufacturers a clear understanding of how energy consumption drives CO2 emissions and how these emissions are allocated across production units, materials, and products. The dashboards consolidate energy, production, and material data, reporting on total emissions, renewable energy usage, and emission intensity trends over time. This enables sustainability teams, ESG specialists, and R&D experts to calculate Scope 1 and 2 emissions, benchmark them against predefined limits, and forecast future emissions and sellable surplus to support reduction initiatives and informed carbon trading decisions.
Intended users:

We help manufacturing companies unlock the value of their data assets by integrating Power BI dashboards with enterprise manufacturing software, third-party services, connected devices, and advanced analytics engines. This ensures uninterrupted data flow, eliminates data silos, and enables a unified view of operations across manufacturing facilities and functional areas.
Data type provided by the system | Power BI dashboard insights | |
|---|---|---|
ERP | Cost data, procurement information, and inventory levels | Material use, unit cost, stock availability, and purchasing trends |
MES | Output logs, time spent on production, and planned vs actual production volume | Production volume, time utilization, and shift performance |
Energy & water management systems | Consumption readings | Energy and water usage, cost, and peak consumption times |
Computerized maintenance management systems & PLCs | Downtime records, work orders, machine performance data, and energy use details | Idle time, maintenance time, root causes, robot OEE, defect rate, and energy per unit |
Inventory management systems | Stock levels and reorder data | Days of supply, usage patterns, and procurement alerts |
Emission monitoring systems | CO2 emissions and conversion values | Scope 1 & 2 emissions and emissions per material/unit |
AI engine | Forecasts, anomalies, and suggestions | Supply risk alerts, stockout forecasts, and robot issue detection |
We develop engaging, tailored Power BI dashboards, allowing manufacturers to accelerate data analysis and reporting, improve data visibility, and boost operational efficiency.
Power BI dashboards provide manufacturing businesses with near-real-time insights derived from comprehensive datasets, highlighting patterns in corporate data that would otherwise go overlooked. As a result, they give executives and operational staff a well-rounded view of the business, improving decision-making and cross-team alignment.
Power BI analytics dashboards consolidate data from multiple systems and spreadsheets and provide interactive charts, graphs, and filters, enabling companies to analyze production, energy, and resource data at different levels of granularity. This visibility helps identify hidden cost drivers, such as excessive energy consumption, material waste, and equipment malfunctions, and take targeted actions to drive improvements in cost performance.
Role-based Power BI manufacturing dashboards with automatic data refreshes centralize data from multiple sources to ensure up-to-date and accurate insights. Equipped with filters, drill-downs, AI-powered insights, NLP querying, and robust sharing and collaboration capabilities, these dashboards enable manufacturers to make faster, data-driven decisions as well as meet strict reporting standards.
Power BI helps manufacturing teams ensure compliance with industry standards and frameworks like SECR and ESG, providing accurate insights on energy use and how it translates into CO2 emissions. Based on this information, companies can pivot their production strategy in a timely manner to meet established obligations.
Since Power BI dashboards eliminate the need for manual data management, manufacturers can save time and effort needed for data analysis and reporting and concentrate on higher-value, strategic tasks. Furthermore, reducing human involvement in data management lowers the possibility of human error, increasing the accuracy and reliability of the insights.
Power BI manufacturing dashboards allow stakeholders to better understand their production capacity and gaps. Equipped with this knowledge, decision-makers can develop more effective production plans to support their scalability goals, market trends, and customer demands and stay more resilient amid arising operational challenges.
The implementation costs of a Power BI manufacturing dashboard depend on multiple factors, including:
The implementation of a Power BI dashboard usually takes 3–5 months, and the project duration varies based on the complexity of the Power BI visualization solution, data management efforts involved, the required solution customization, and post-implementation support needs.
$47,000
An essential minimum of dashboards,
no need for establishing complex ETL pipelines, and a basic
dashboard UI design
$87,000
An extended collection of dashboards, intricate ETL workflows, and customized UI
We implement Power BI dashboards, tailoring them to our clients’ business needs and user roles to help them connect, visualize, and share data across the organization.
Itransition’s Power BI professionals implement full-fledged solutions on top of Power BI, creating a powerful and scalable ecosystem for managing enterprise data.
Power BI is Microsoft’s business intelligence platform that natively connects to Microsoft services and 100+ data sources, including Excel, CRM systems, enterprise data warehouses, and others, and comes with comprehensive features for analyzing and visualizing data that are suited to both technical experts and non-IT teams. All these factors make Power BI a good long-term investment for manufacturing companies that need a powerful yet user-friendly solution to interpret their data and automate reporting.
A manufacturing execution system (MES) is used to collect machine data, production volume, shift activity, and equipment downtime, gathering shop floor data in real time. Power BI aggregates, analyzes, and visualizes data from diverse sources, including MES, ERP tools, and PLCs, and presents the insights in a centralized, streamlined interface, providing a holistic view of data spread across numerous domains.
Power BI dashboards for manufacturing can be tailored to different specialists in the company, from key decision-makers to frontline workers across operations, production, finance, and sustainability teams. Besides, Power BI offers self-service and enterprise business intelligence capabilities built for both IT and business users.

Service
Itransition offers comprehensive Power BI consulting services to help companies successfully implement and continuously enhance solutions on top of Power BI.

Case study
Learn how Itransition implemented Power BI and customized dashboards to be user-friendly and flexible for a research consulting firm.

Case study
Learn how Itransition’s dedicated team delivered risk management software support for a Dutch provider with 5K+ enterprise clients globally.

Case study
Read about Itransiiton’s case study and expertise scoring systems that help us easily analyze expertise coverage and pinpoint areas for improvement.

Service
Itransition delivers scalable software to help manufacturers automate business processes, optimize manufacturing operations, and improve decision-making.

Service
Itransition provides expert data visualization services to help companies present complex data in an intuitive way, spot trends, and make informed decisions.