In the ten years since machine learning adopted GPU acceleration, lower-level languages such as Python and R have come to the forefront of the analytics scene, reversing an earlier trend in business intelligence implementation towards simplification, 'flat' databases, unified exchange formats and 'user-friendly' data exploration platforms.
Nonetheless, the new ascendance of Python and R has not been matched by improvements in the most popular third-party visualization, mapping and data exploration libraries, such as Matplotlib, ggplot2, and Seaborn, whose workmanlike output caters more to the internal needs of the academic and commercial research community than to the boardroom pitch, or the expectations of licensed analytics dashboard clients.
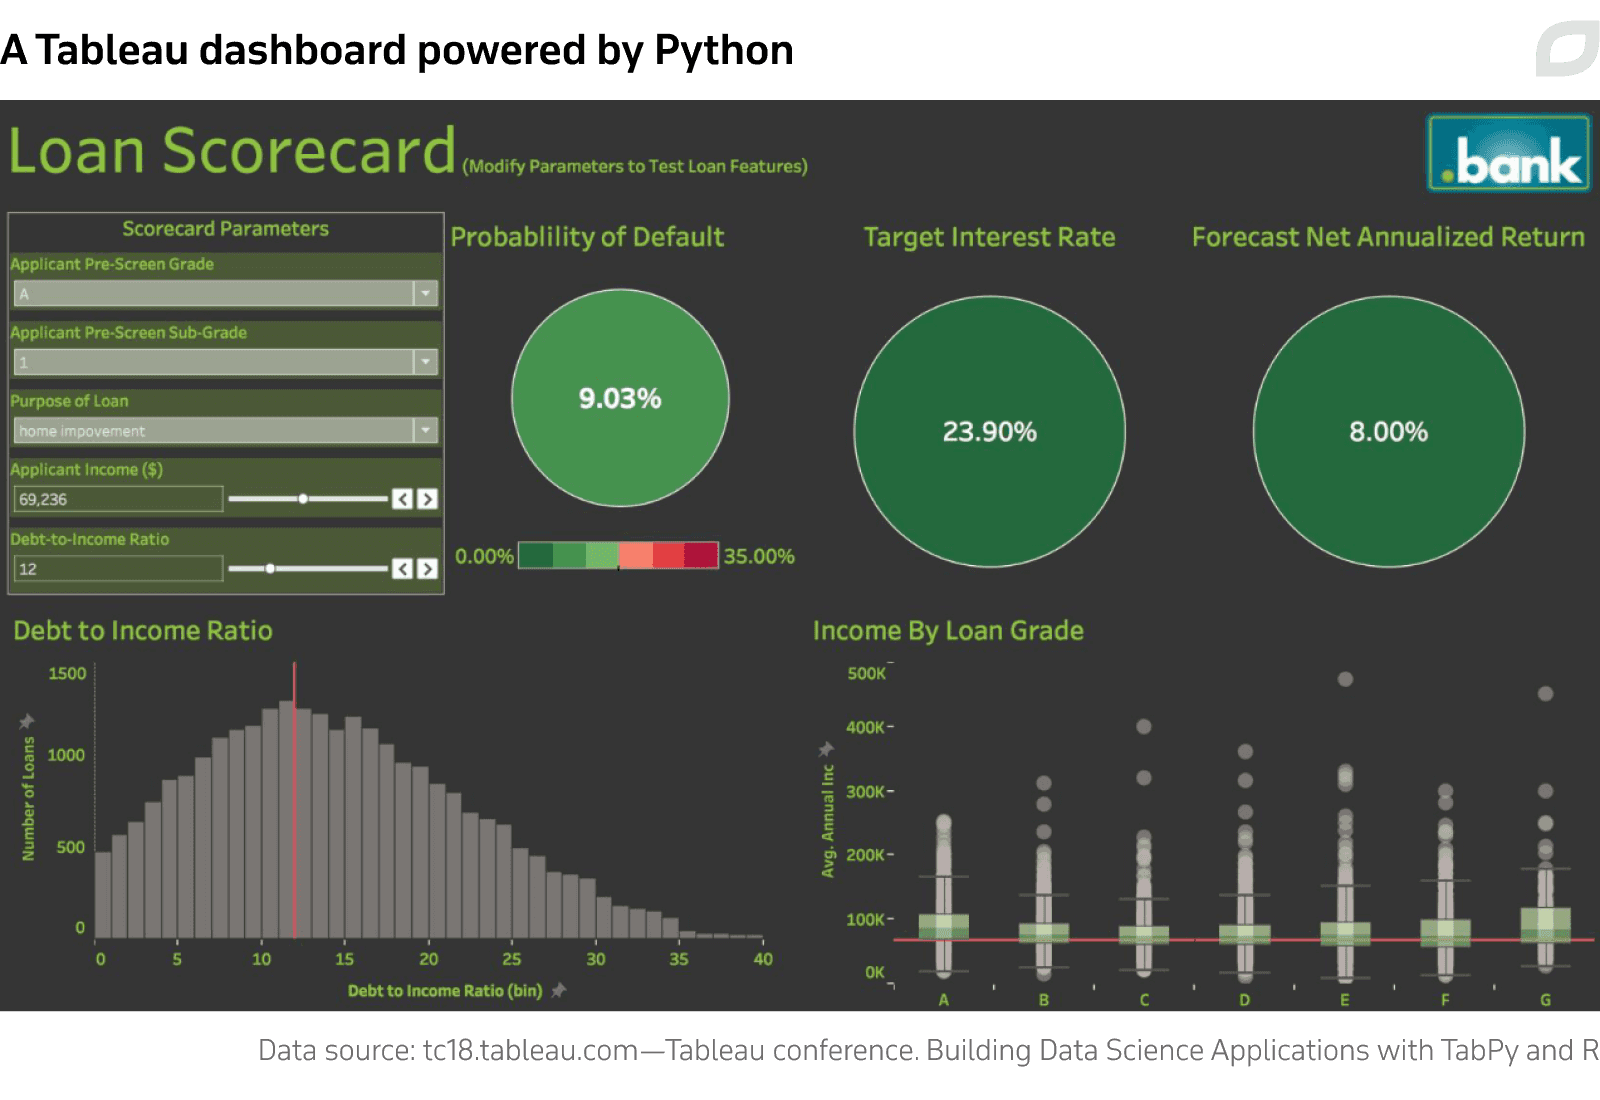
However, it's now possible to interact directly with neural networks and machine learning models directly in the Tableau business data visualization suite, and to apply a superior layer of styling whilst exploring live data with a high level of interactivity and responsiveness.
In this article, we'll take a look at some of the most popular ways that data science can be made explicable, explorable, and appealing through Tableau development.
Advantages of using Tableau for data science
- Better visualization with less code
Tableau's core mission is the exploration and visualization of data. These are important but secondary objectives in broader data science programming languages such as R and Python, where the quality of third-party graph-generation tools is not always the greatest. - Superior exploratory data analysis
The ability to represent initial data loads prior to modeling is very useful for evaluating the approach to be taken, and is difficult to recreate in the native SDKs and APIs of popular data science languages. - Native clustering
Cluster analysis is a native function in Tableau and a one-click application in a dashboard, whether the data is imported from flat files or coming in live through a service (see below).
Leveraging Python with TabPy
Python's current supremacy in the data science and machine learning sectors makes it an essential platform for business development. Though there are many tools and frameworks for big data visualization available in the Python ecostructure, few of them are capable of producing the visually compelling results that can make or break a pitch, as Tableau can.
Tableau offers a dedicated Python server called TabPy, through which users can remotely execute Python code ad hoc and serve the results up as Tableau visualizations.

TabPy operates as a service, similar to many of the default data import routes in Tableau, such as SQL-based sources and cloud-hosted data. The TabPy service is usually installed on Windows via PIP in a cloned repository instance on Anaconda, though it can also be installed via GitHub.
TabPy's Default Statistical Functions
A default installation comes with several pre-built statistical functions, including Density-based spatial clustering of applications with noise (DBSCAN), which calculates clusters based on the user's definition of a maximum allowed difference between two points that share a cluster:
In the above example the Python data is stored locally. However, TabPy can also execute Python code remotely through the JupyTab server, which enables data exploration via Jupyter notebooks. This provides a desktop installation of Tableau with pass-through access to a high-powered web-based machine learning infrastructure, including the formidable compute resources of AWS and Google.
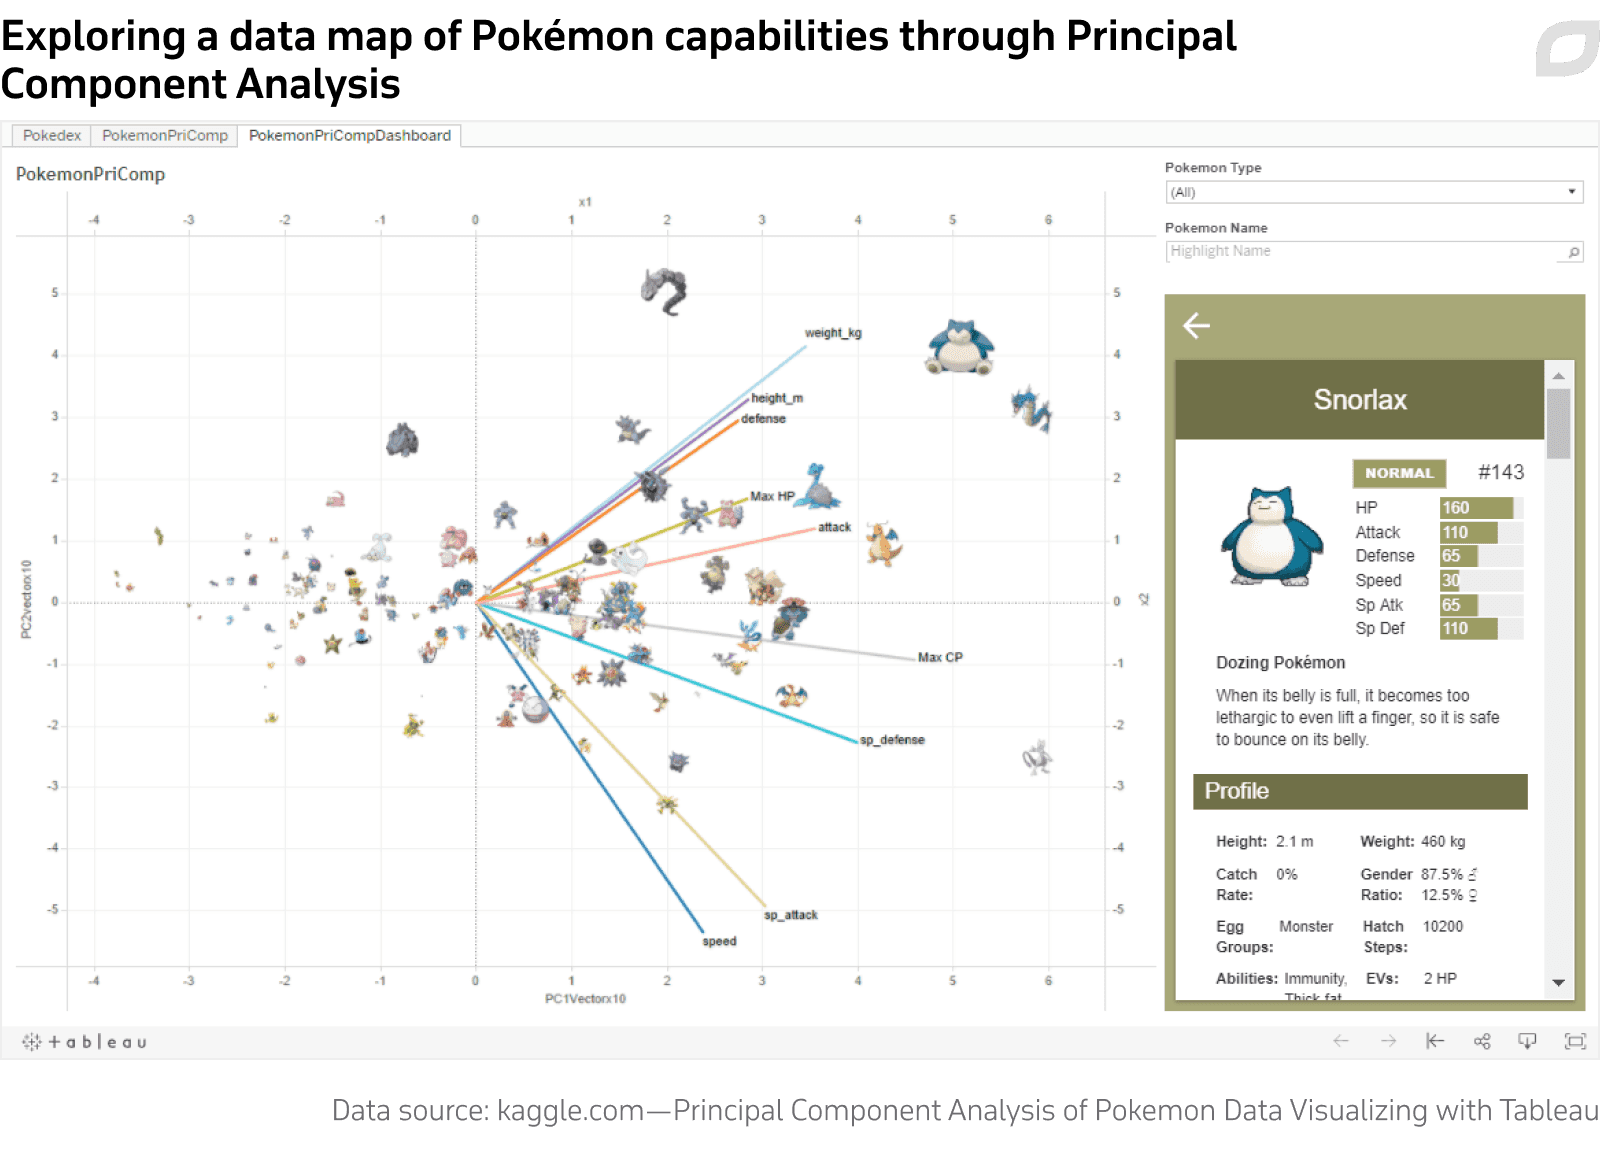
Pre-deployed functions in a base install of Tableau include Sentiment Analysis, T-Test, ANOVA, and Principal Component Analysis (PCA).

Python scripts in Tableau Prep Builder
The data exploration tool Tableau Prep Builder allows users to build script-based workflows for preparing and presenting data.
Prep Builder has been offering support for Python (as well as R) since 2019. In the case of Python, TabPy performs data operations transparently through Pandas dataframes.
After adding a script step in Prep Builder, the step is configured to open a .py file that will call a function. After the function has received the Pandas dataframe and performed actions on it, a new dataframe is returned. If the modified frame has different or additional functions to the one that was initially passed, the script flow will need to implement a get_output_schema function to define those new column names, so that their variables can be used in the workflow.
We create enterprise business intelligence systems
R integration with Tableau
R is an open-source statistical computing language that has recently begun to rise from its 1970s roots into one of the most popular platforms for data science. R specializes in clustering, time series analysis, linear and non-linear modeling and statistical tests.
Though Python has won a vanguard position in data science in the last ten years, R's focus on data science analysis—which, among other factors, makes it easier to learn—has boosted its popularity since the outbreak of COVID-19. This, in turn, has led to a greater global scientific focus on pure statistical analysis and theory.
Tableau has native support for R in the desktop and server environments, via four scripting functions:
- SCRIPT_REAL
- SCRIPT_STR
- SCRIPT_INT
- SCRIPT_BOOL
Like Python, R integrates well with Jupyter notebooks. For the purposes of Tableau, however, the most efficient integration comes via a local service that's easy to set up. Tableau Desktop and Tableau Server need to be connected to a local install of the Rserve binary server for R. With integration complete, it’s now possible to import R data in Tableau.
In the below example, a CSV dataset is imported into RStudio and parametrized into a cluster map. With the same CSV file also imported into Tableau Desktop, and with the RServe connection already established, one of the four core R functions native in Tableau is called. Next, the user is creating a linear regression-fitted visualization on the imported CSV data via R. These two elements, the native CSV import and the R-calculated linear regression fit, are dragged into Tableau to exploit R's superior analytical capabilities.
In a side-by-side comparison, we see that the base visualizations are in parity between the two platforms. However, we now have the option to apply any of the much wider available stylings in Tableau to the R-derived data. Any available parameters can be dynamically changed in Tableau. For instance, where the data has date information, we can zoom in on a particular year or other unit of time. We can also partition the data and remove outliers.
Where the RServe and Tableau combination are going to be required on a long-term basis in a Windows environment, it's also possible to install RServe as a native service.
MATLAB integration with Tableau
Conceived back in the 1960s, the MATLAB programming language is even more venerable than R, and has since developed into a proprietary platform specializing in matrix manipulations, function plotting, and algorithm development. MATLAB is also a strong environment for signal plotting, image processing, computational biology, and financial modeling, among other sectors.
While MATLAB is capable of interfacing with a variety of other programming languages and development platforms, its dashboard output lacks finesse—an ideal use case for Tableau/MATLAB integration.
MATLAB can be installed locally on a PC with internet connectivity, for purposes of license authentication. While the MATLAB server is tooled for a connected network environment, it can be installed on an offline Linux or Windows machine if necessary.
Besides a local installation of the Production Server for MATLAB, other requirements include a base install of the MATLAB desktop environment, and the MATLAB compiler and compiler SDK.
For financial reports and analysis, MATLAB's Financial Toolbox offers a wide array of statistical analysis and mathematical modeling features, including Time Series Analysis (TSA) functions and a full suite of Stochastic Differential Equation (SDE) models.
Graphically appealing portfolio modeling is one of the biggest strengths of combining Tableau and MATLAB, and offers the possibility to develop data-rich and interactive dashboards that let the user drill down into the data based on any parameter, such as time.
Besides superior visualizations and an easier UX, using MATLAB via Tableau can speed up data exploration. Although dealing with data natively in MATLAB offers the user greater flexibility, it also requires more code.
Leverage data science in Tableau for your business

Tableau consulting
Itransition's engineers are well-versed in Tableau's for data visualization and can deliver tailored Tableau-based solutions to drive decision-making.
Einstein/Tableau CRM in Tableau
In October 2020, pending new updates and deeper integrations with Tableau, Einstein Analytics was renamed to 'Tableau CRM'. Since Salesforce Einstein remains 'the overall AI brand for Salesforce', we'll continue to refer to 'Einstein' in this section.
The Einstein platform, launched as a standalone service in 2017, offers a suite of 36 categories of AI-enabled functionality, with differing availability depending on the subscription price. The core machine learning capabilities are broadly covered by computer vision; natural language recognition; and automatic speech recognition.
- Einstein Prediction Builder
Prediction Builder allows developers and admins to create custom-specced predictive models via a programmatic and simplified interface.
- Einstein Discovery
Discovery applies generalized statistical and analytical machine learning routines to a client's CRM data, again based on user-defined requirements. However, Discovery focuses on current data exploration rather than the extrapolation of trends into predictions, as Prediction Builder does.
- Einstein Next Best Action
Next Best Action is a rather more flexible version of the previous two wizard-centered workflows, with greater control over what criteria are applied, where that information becomes available, and an emphasis on sophisticated business intelligence systems.
Machine learning in Einstein
Einstein Language performs sentiment analysis on a variety of documents within Salesforce deployments, calculating from content whether correspondents and customers are happy or dissatisfied, among other predictive capabilities. Combined with user-defined alerts, this allows the client to get ahead of incipient issues that may arise in a business relationship.
The three APIs available in Einstein Language are:
- Einstein Sentiment
Also available for external use, Sentiment provides analysis models that can infer meaning from unstructured text, and assign a 1-10 rating for negative>positive values. These can be used as triggers for scripting.
- Einstein Intent
Einstein Intent allows the user to train datasets into models capable of evaluating client intent. Salesforce provides a quick-start guide based on an example of creating a model for routing support cases.
- Einstein NER (Named Entity Recognition)
NER allows the system to define a unique entity from the stream of text and media analysis, such as 'payment', 'email address' and 'customer'. Without entity recognition, it would not be possible to define relationships and quantities for machine analysis.
Einstein Vision
Einstein Vision uses machine learning algorithms to extract semantic and literal meaning from image-based content. This enables a variety of possibilities, including brand detection, visual search, and product identification.
Among other functions, Einstein Vision facilitates object recognition; optical character recognition (OCR), which can create searchable text from image text; and image classification, where the user can either make use of the system's generic capabilities, or specifically train a model to identify a class of object (such as a brand label).
Einstein Vision also has beta support for PDFs, which present particular challenges for deriving legible text, due to the way that optimized PDF exports often mangle and re-interpret the flow of characters, despite appearing legible to the user.
Using Einstein in Tableau
Since the March 2021 release of Tableau 2021.1, Einstein integration has become more extensive in the Tableau environment, with further integrations and functionality promised throughout 2021.
Innovations currently available include:
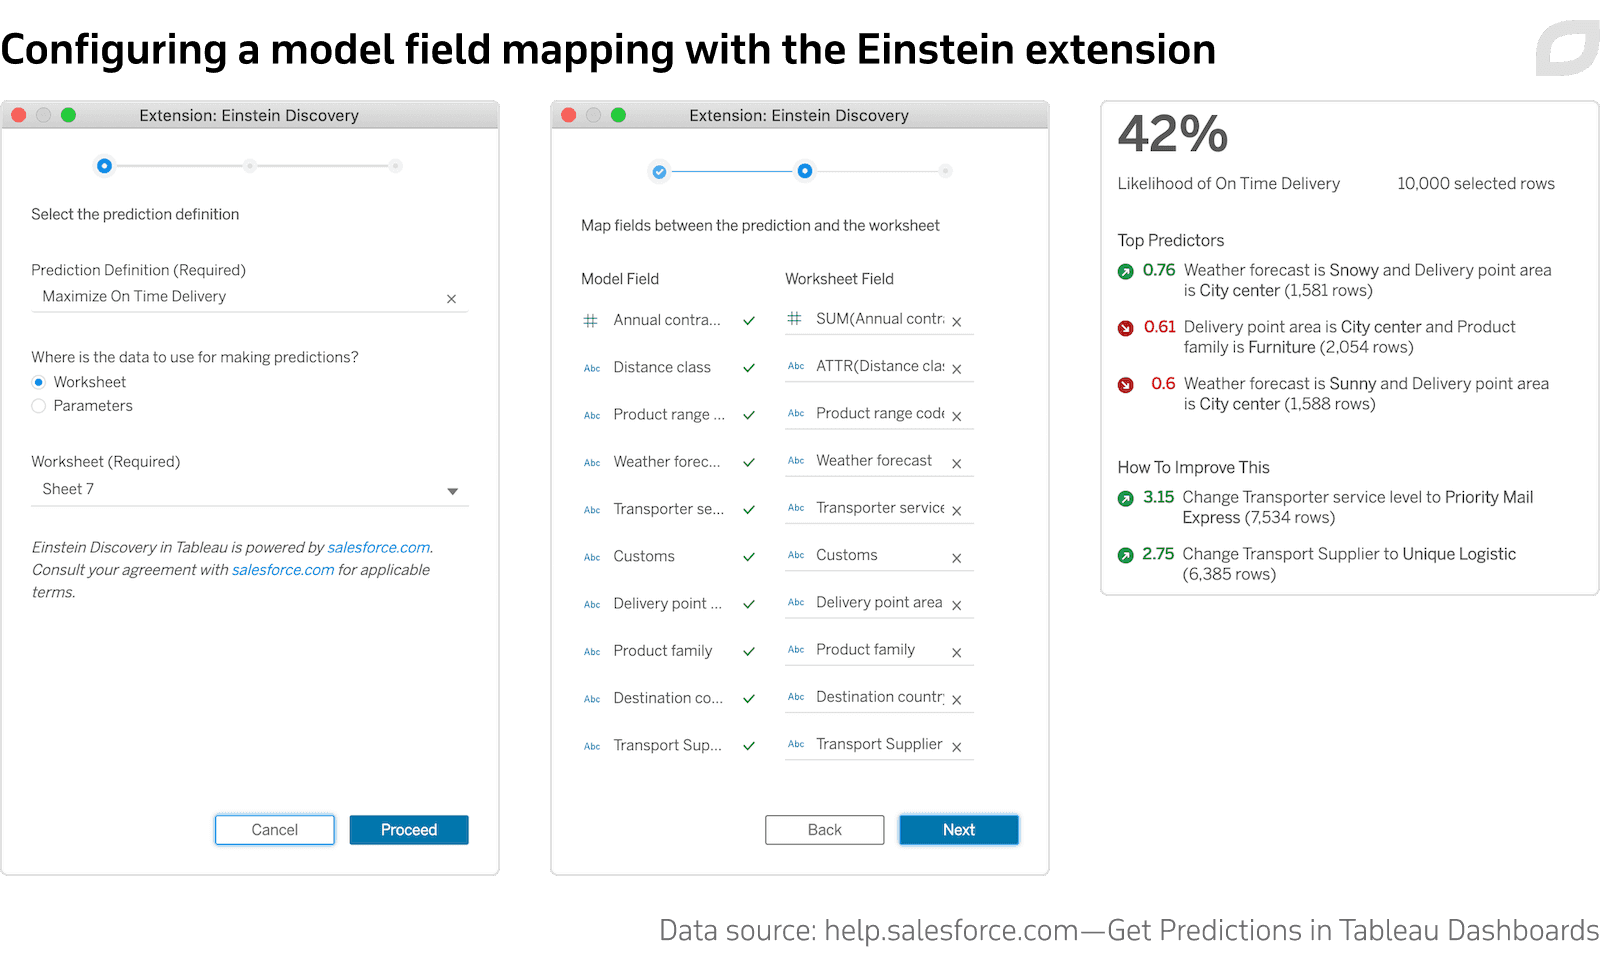
- The Einstein Discovery Dashboard extension, accessed via a new in-product extension gallery, which allows the user to interactively explore hypothetical scenarios and can embed live predictions into worksheets, with support for importing bulk predictions for up to 50,000 data rows in one operation.

- Prep Builder support for predictive insights and bulk scoring, which can add predictions into a Prep Builder workflow and allow historical data to inform the reporting of likely outcomes.
- Quick LODs, which allow a user to drop a measure onto a dimension and instantly calculate a Level Of Detail (LOD) expression.
- Einstein integration with the Tableau calculation engine, which provides a new Einstein Discovery connection class for a calculated field, making it possible to drag and drop predictive calculations into Tableau visualizations.
Upcoming features for Tableau and Einstein include the ability for Tableau Prep to write directly to Einstein Analytics; for Einstein to write directly into Tableau; deep exploration of native Einstein data through Tableau queries on CRM data; and an eventual merging of the two platforms into a transparent and unified experience for the end user.


