
BI system modernization for order management
Itransition designed an ETL process, built a data warehouse, migrated 150+ complicated reports from Avora to Power BI, and achieved up to 24 times faster data delivery from the OLTP to an OLAP system.
Table of contents
Context
SEKO Logistics is a software technology company with 120 offices in 40 countries, including the UK, the USA, Hong Kong, and the Philippines. They specialize in supply chain, transport, logistics, product, and warehousing management and provide customizable IT products for supply chain visibility and collaboration.
For hundreds of clients, they used large amounts of data to build analytical reports on managing the inventory and order lifecycle, with their order volume growing by 1,5+ million orders every year. The data users of the solution are SEKO’s clients, such as warehouse managers and delivery agents.
However, the customer had the following concerns about their legacy analytics solution:
- SEKO used the Avora data analytics software as their BI system, which did not match the growing order volume.
- In Avora, the data update window varied from 12 to 24 hours, depending on the entity updated, and the customer wanted to accelerate updates, achieving almost real-time data delivery.
- Reports in table form weren’t intuitive and easy to use, with some of them loading slowly, lagging, and not working properly.
- System users couldn’t make bespoke reports themselves, and only BI/data engineers could deliver them.
- SEKO wanted to switch from Avora, which was the only third-party service in their Microsoft-based infrastructure.
- The customer also aimed to minimize the load on the SQL server.
We have already been delivering .NET web development services to SEKO since 2014 and established ourselves as a trusted service provider. During the collaboration, the customer got acquainted with our BI Competence Center and experience in BI projects. The customer wanted to automate decision-making using advanced diagnostic, predictive, and prescriptive analytics, so they asked us to provide BI services and move from Avora to Microsoft Power BI. Besides moving to Power BI, they needed an ETL process setup and a data warehouse. The customer also wanted to gradually switch from legacy tables to intuitive dynamic dashboards with automated data-driven decision capabilities.
Solution
The modernized system analyzed anomalies and outliers and provided predictions on delivery peaks and slumps, necessary warehouse space, number of employees, and other vital tendencies.
ETL process setup
To update the solution, we analyzed the existing BI system and its use patterns and studied the customers’ documentation, database, and client reports. Our team designed the customer’s ETL process, built a data warehouse, and moved SEKO’s system from Avora to Power BI. To service hundreds of SEKO’s clients, with dozens of analysts consuming and analyzing data, we implemented Power BI Premium with a capacity for 1000+ users and set up RLS to make access level tiers for different users. Besides building dozens of intuitive analytical dashboards, we also consulted SEKO on future-proof BI functionality and modern BI trends. We also created project documentation for centralizing information and making onboarding easy.
SEKO had an OLTP (online transaction processing) system exporting data in constant increments. All data on orders was saved in the OLTP system, while all data analysis and reporting were performed in the OLAP (online analytical processing) system in Avora. We decided to build a separate DWH (data warehouse) and designed an ETL process for the OLAP system to avoid overloading. The ETL process incrementally copies data from SEKO’s OLTP system to the OLAP system. We built the ETL process using Azure Data Factory and a single Power BI dataset that is the data source for all Power BI reports.
As requested by the customer, every hour we got updates for the last increment, trying to achieve near real-time data updates for 1000+ users with the ability to add unlimited users. Thanks to the new solution, the data delivery delay from the OLTP to the OLAP system is no more than an hour. Usually, such an update speed means 3x higher infrastructure costs, but our developers optimized the dataset size, cutting it from more than 25 to 9 GB to keep the costs within the Power BI Premium P1 plan while enabling numerous extended features.
Having analyzed SEKO’s business model, we suggested using a three-month period for incremental refreshes since all order lifecycles take the same time, with the data attached to a specific order remaining unchanged.
Report migration
Before migrating 150 reports from Avora to Power BI, Itransition analyzed them, focusing on visual elements such as tables, charts, KPIs, and maps, to select the correct data model for complex analytics. We made a cataloged list of reports, grouped them by similarity, and gathered requirements for future reports. Upon the customer’s request, we also located and eliminated duplicate reports. Now, instead of working with multiple reports, users apply filters to get the necessary data.
Then, we created an optimal DWH model that delivers data to Power BI. We moved and transformed data, created a data warehouse, and used SQL scripts to prepare data marts utilized by Power BI to refresh data. To minimize data errors affecting business, our BI team launched quality checks that track the correctness of data coming into the dataset. If a discrepancy occurs, the team corrects it and resolves the incident. We also set up push notifications and automatic delivery of reports on whether the data check was passed to the responsible parties. This procedure allows us to detect issues before they affect the solution.
Since the customer wanted to accelerate the migration, we temporarily onboarded two additional Power BI developers to meet the tight deadline.
Microsoft ecosystem
Tool unification under the Microsoft ecosystem resulted in the reduction of services used, seamless integrations with other system parts, and automated system updates. We also unified user management using Azure AD, eliminating the need to create and manage a separate Avora user account.
Row-level security
In Avora, the customer had data access rights for different user groups, and with the move to Power BI, our team set up Row-Level Security (RLS), limiting data visibility for various users. Access to different reports is based on the region, department, responsibilities, etc., and is given by admins.
Power BI apps
Before the move, SEKO’s hundreds of reports were difficult to navigate. To group reports, centralize them in one space, build an easy-to-navigate hierarchy, and limit access to reports and workspaces, we packaged and categorized reports into six Power BI apps that combine reports with workspaces for a better user experience. Apps simplify permissions management for admins, allowing them to set access rules different from those on the workspace. We use PowerShell Scripts to deliver reports to workspaces.
Deployment pipelines
To ensure the new Power BI solution’s constant availability and reliable operation, collaborate effectively, and manage the content lifecycle, our team used a deployment pipelines tool. It allowed us to develop and test reports and datasets in the Power BI service before this content is accessed by users. The pipelines are organized into development, testing, and production workspaces. Developers design and review content in the development workspace, then deploy it to the pre-production environment for testing and preview, where we verify and prepare it for distribution to the production workspace. Content in production is available for access to end users.
Dynamic dashboards
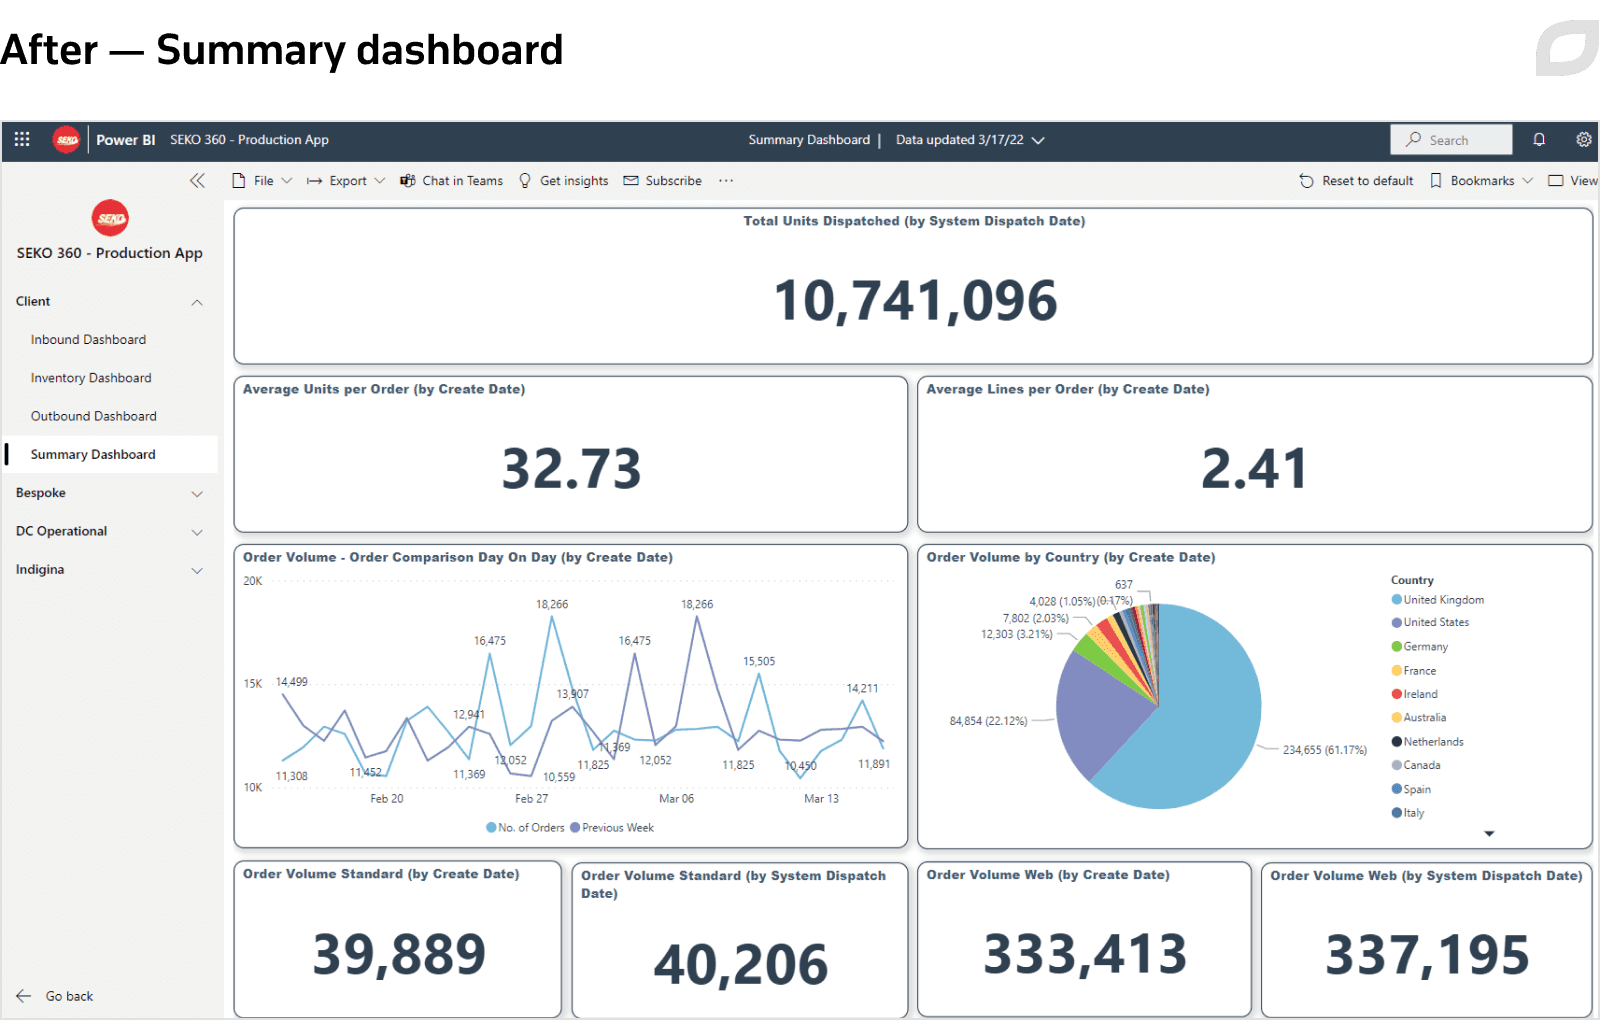
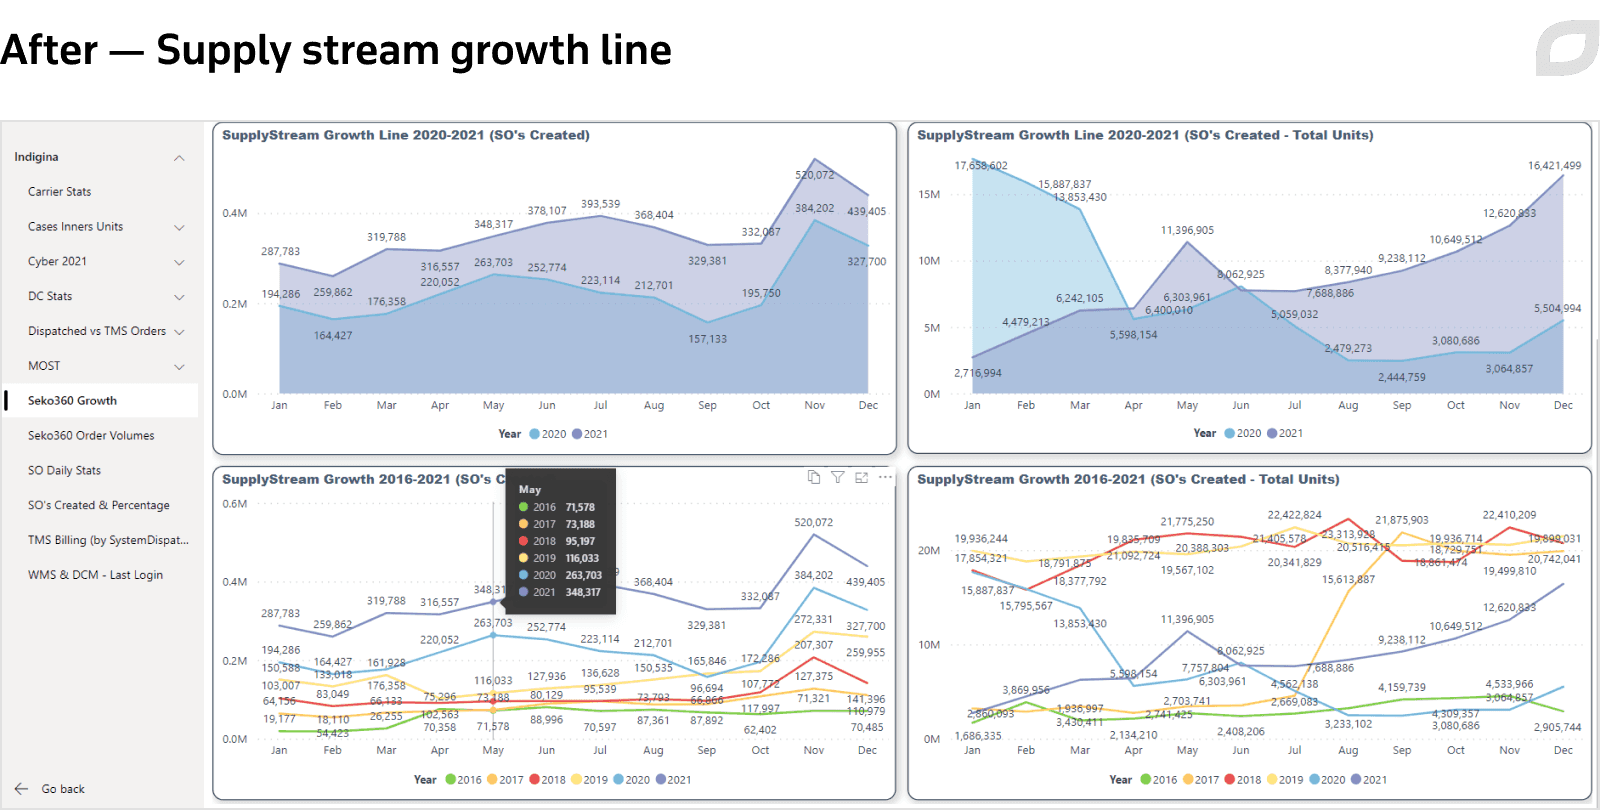
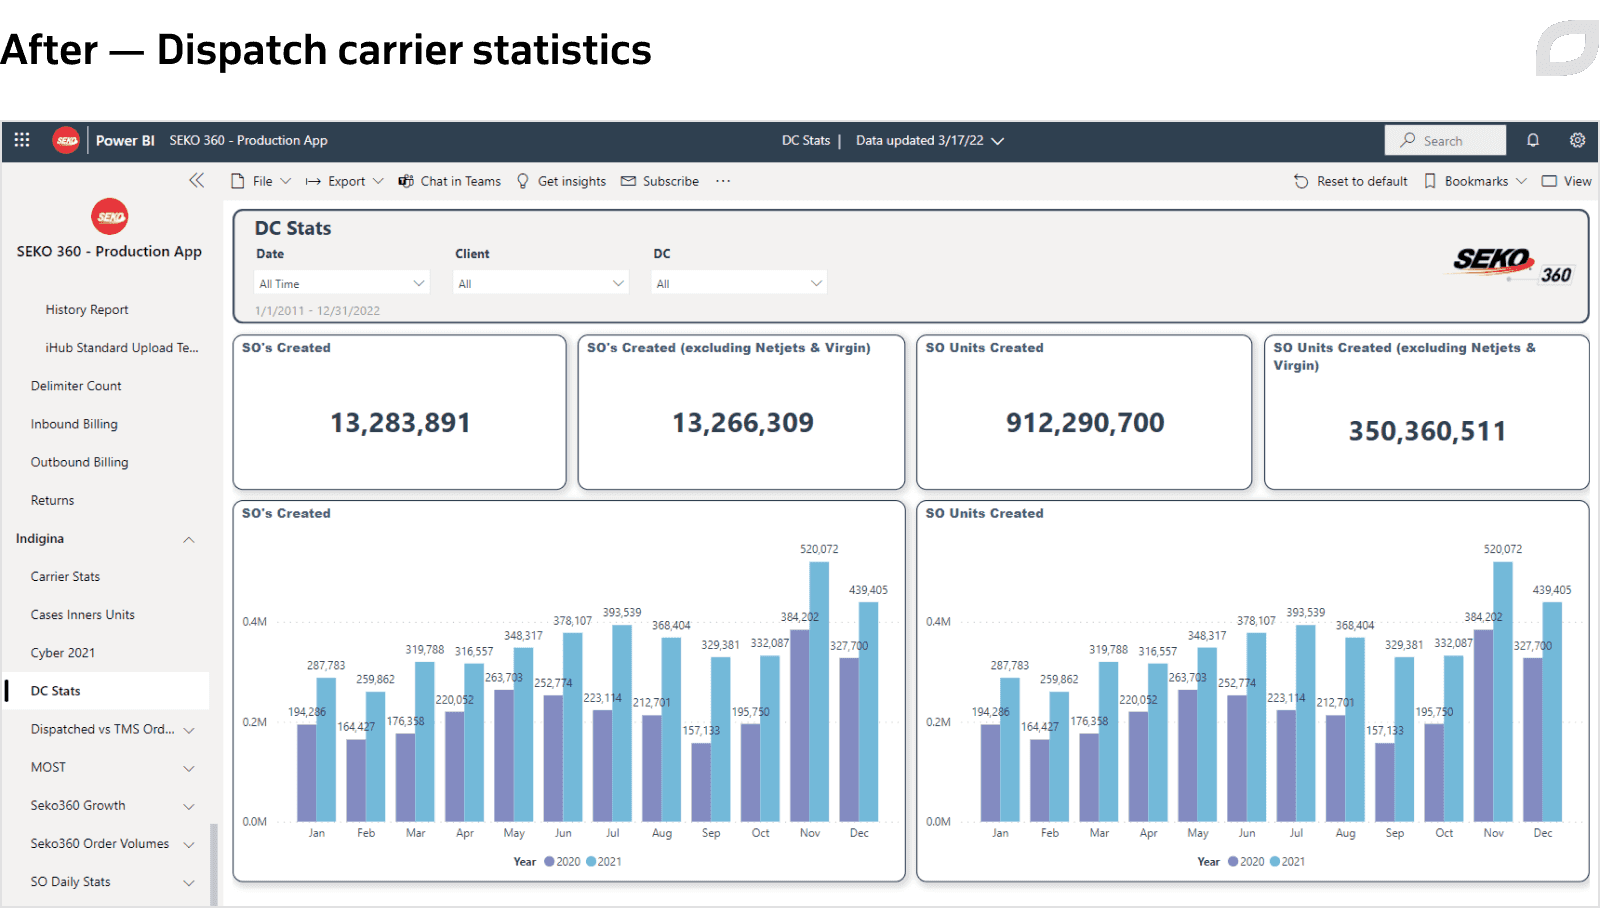
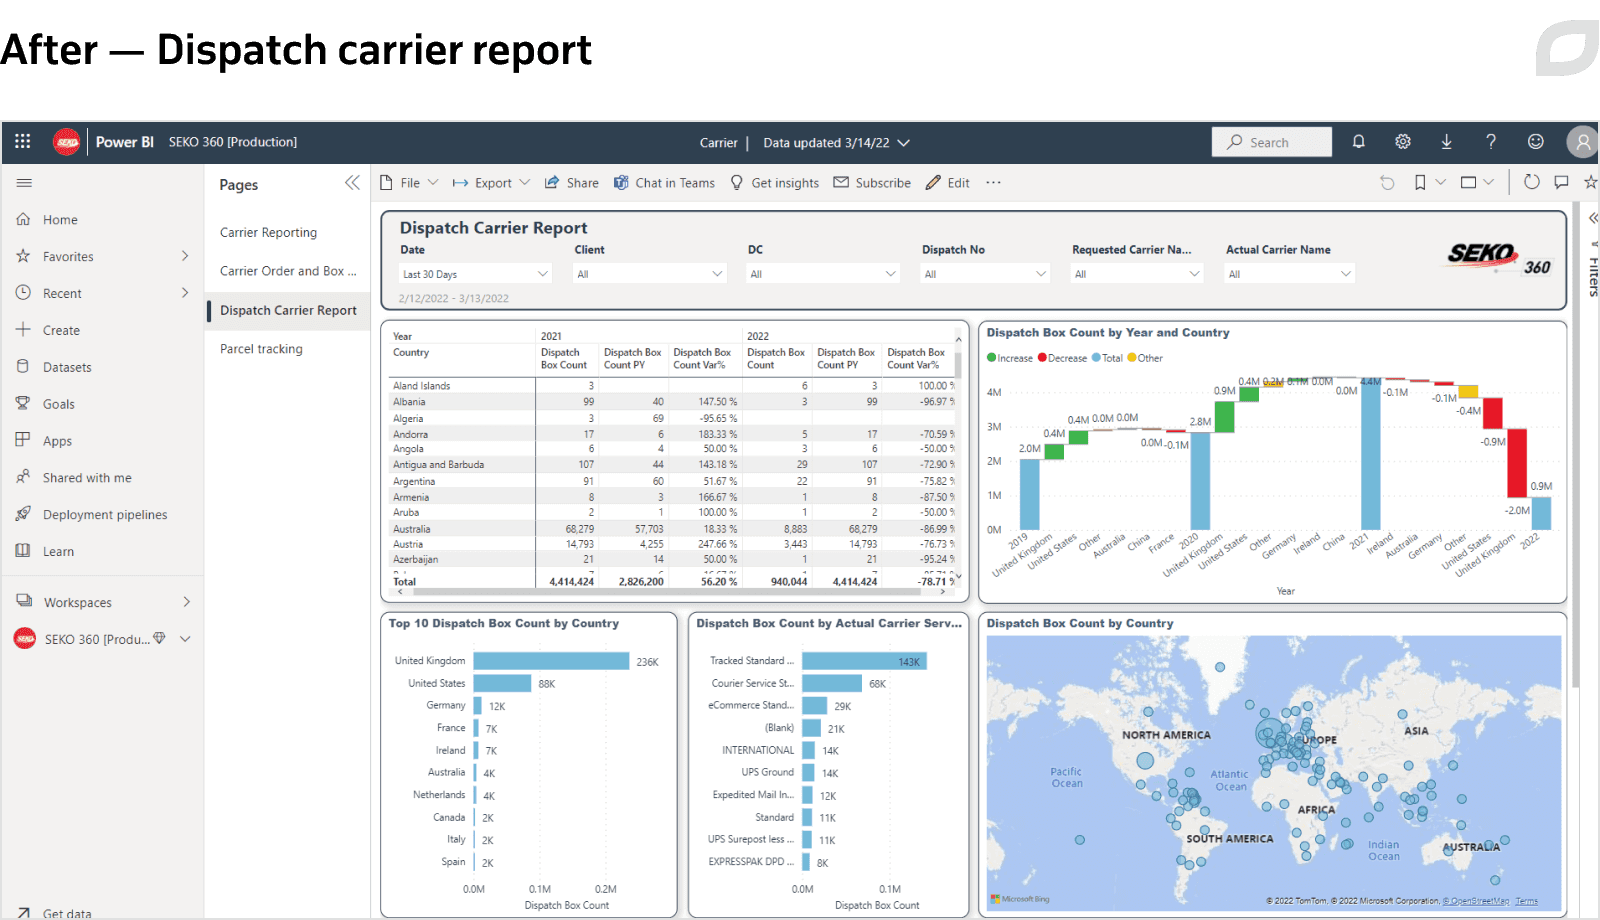
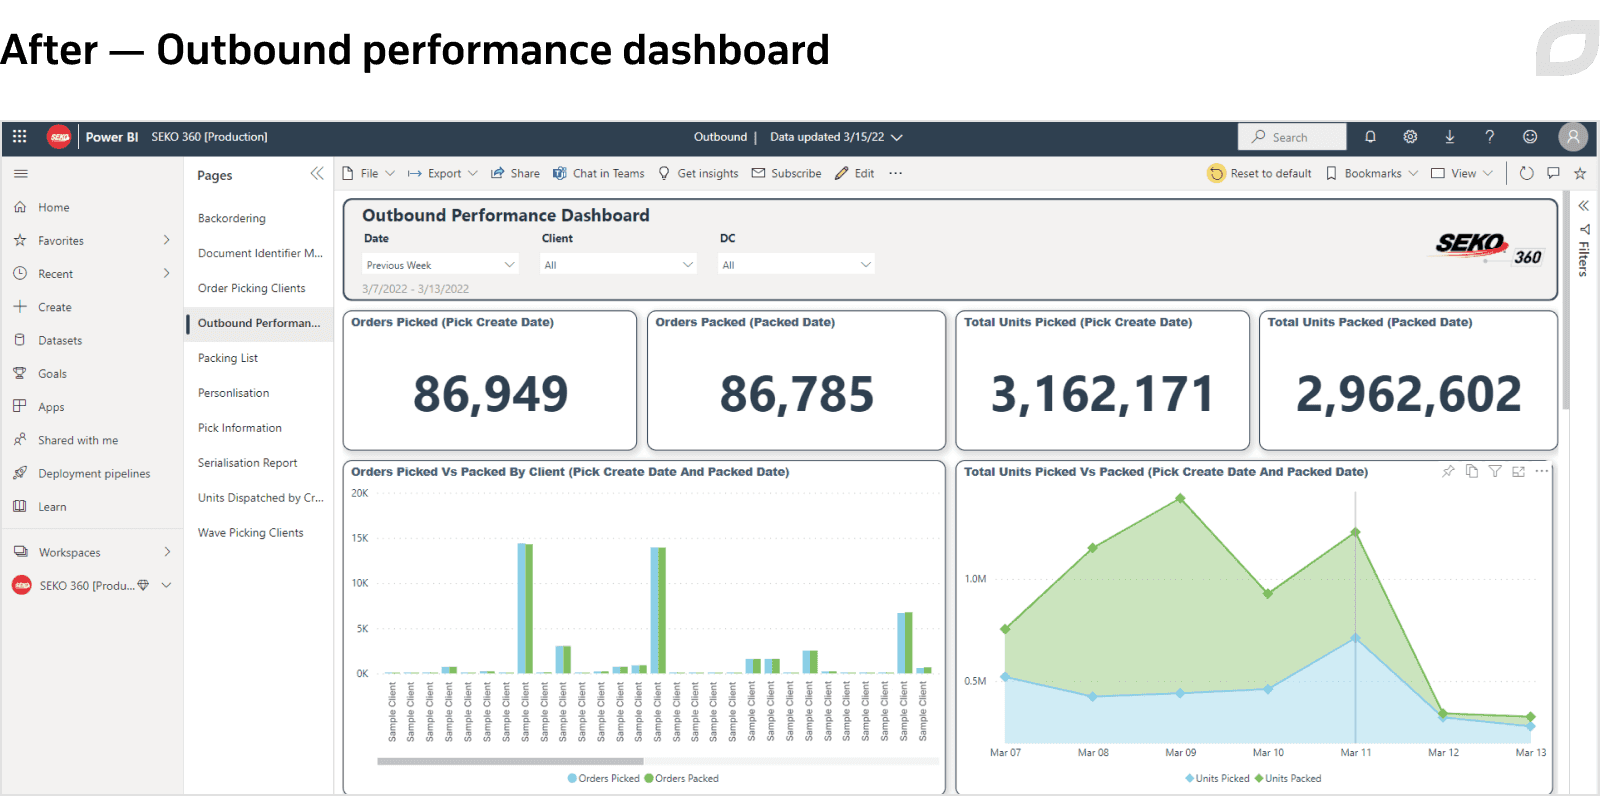
After the solution was moved, we started a subproject to modernize legacy table reports and transform them into intuitive dashboards with intuitive charts and maps.
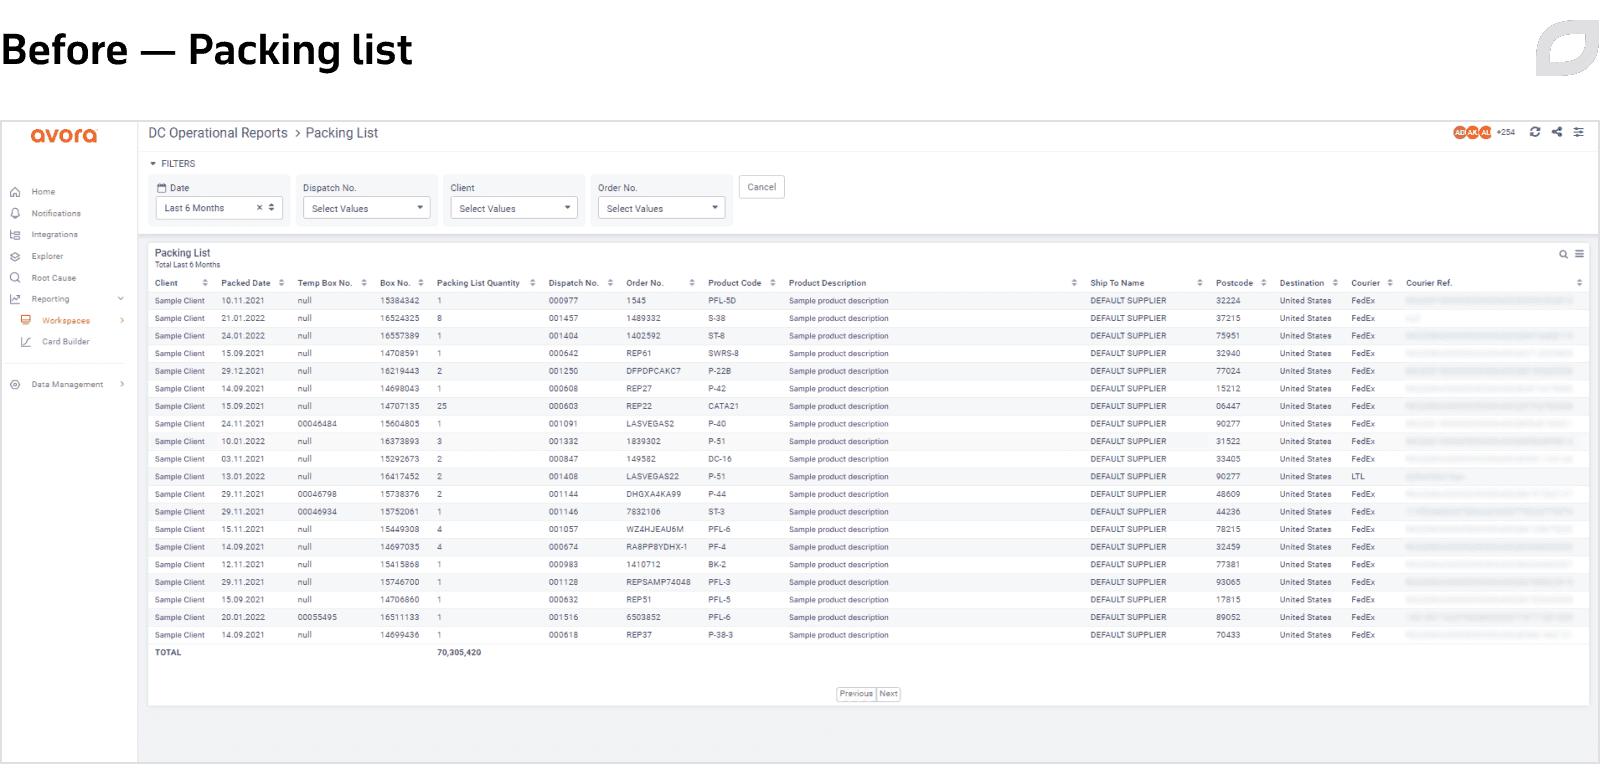
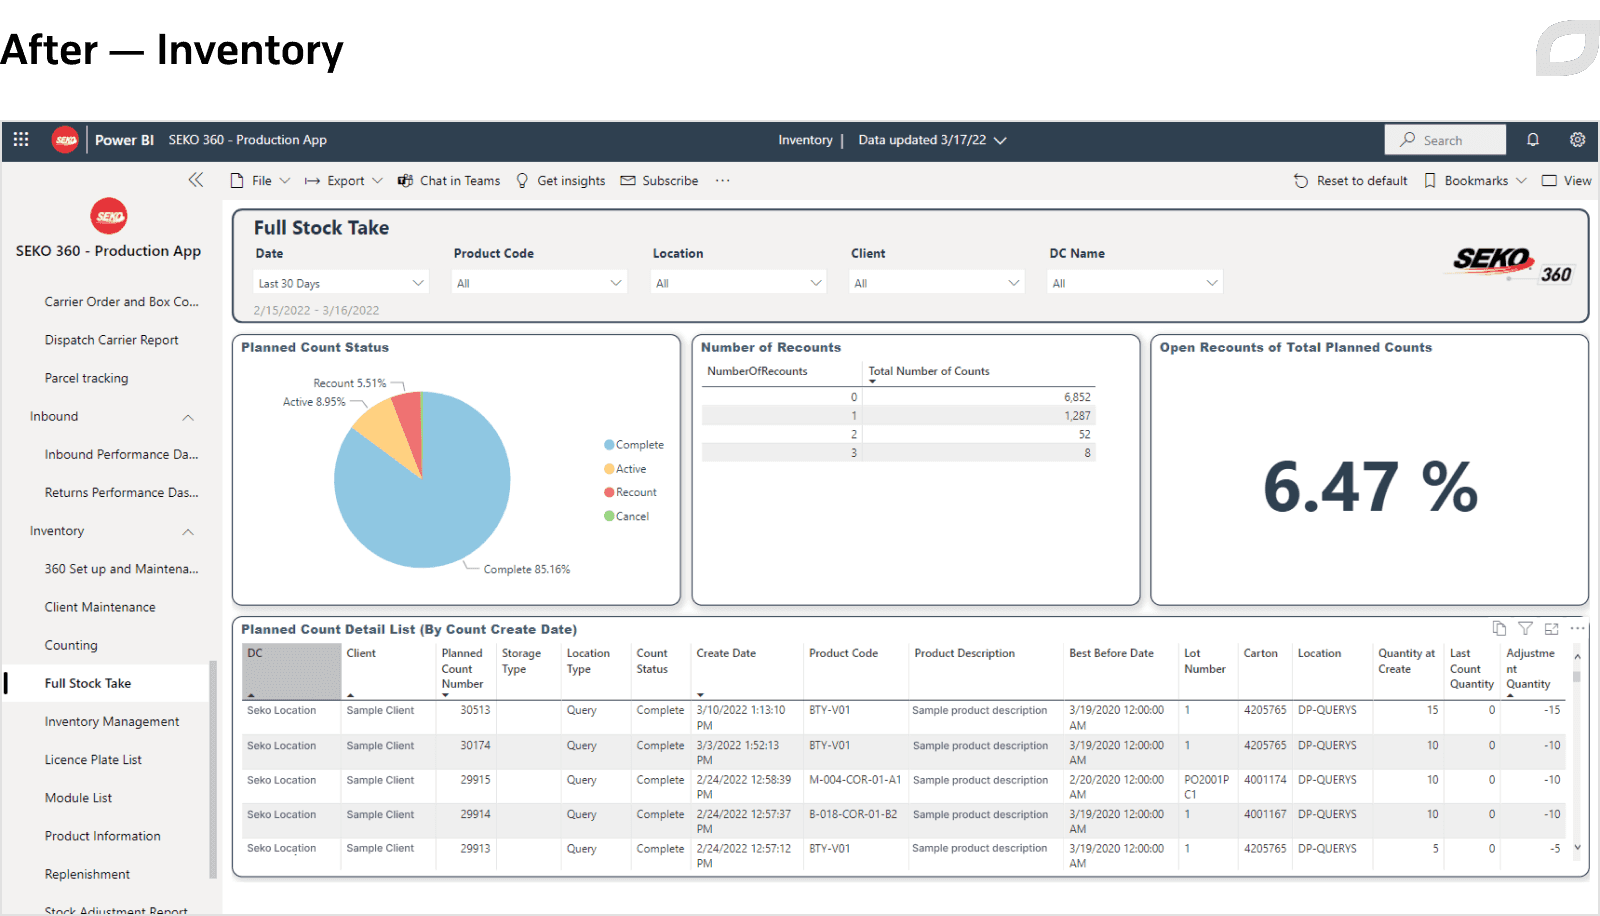
To design and develop intuitive dashboards, together with the customer, we decided on case-by-case improvements of visualizations and reports that drive deeper insights and more informative decision-making without switching the design drastically to keep the users happy. The upgraded dashboards feature charts, chart pies, graphics, and maps to show performance, supply stream, and dispatch carrier statistics dynamics.
Other improvements
Our team also implemented the following solution improvements based on the consultation with the customer:
Plugged customer web apps data into Power BI
The customer had web apps for automating document flow and manual operations. We plugged the web apps into our Power BI solution to generate additional reports for them. For the first web app, we united the data from all those sources and embedded them into a common data model to perform intersystem data analysis. This allowed SEKO to save web app developers’ time and effort on loading CSV reports manually. Using the Power BI solution is more effective, flexible, and faster and ensures better data quality, easy scalability, and convenient support. For the second web app, we added data processing, reporting, visualization, and analytics capabilities, scaling the web app to support automated BI reports.
Paginated reports automation
The team used Power Automate to deliver scheduled paginated reports to the customer’s FTP server and email. To ensure fast sharing and printing, we developed one-page reports displaying all the necessary data in one table, even when original reports take up multiple pages.
Full weekly data update
The data in the developed solution is updated hourly, but the incremental refresh only affects data from the last three months. Due to SEKO’s business specifics, there were cases when old data was altered but the changes were excluded from the regular update. To solve this issue, we implemented an automated full data refresh once a week (every Sunday) that updates all the data, minimizing the risks of errors and invalid data entering the system.
Usage metrics reports
Our team set up the generation of consolidated user metrics reports in Power BI, detailing report views and download statistics. Now the customer can track report popularity using metrics like the number of reports opened and downloaded. They can also measure report performance thanks to metrics like speed of opening and loading, errors, etc. Users can track report performance and data usage during high load times, such as seasonal and holiday sale periods. Underperforming reports that remain unused over time can be excluded from the solution.
ABCD client classification
Itransition’s BI developers also took the first step towards predictive analytics and intelligent decision-making implementation by introducing ABCD client classification. It categorizes all orders and dispatches, helping determine which percentage each product group takes up from the traffic volume. Our BI engineers gathered and united data into a dynamic table for a full, consolidated picture. This way, SEKO can track top clients who make up the majority of dispatches, as well as dispatch count by year, month, client, ABCD, etc. They can also forecast demand for different products, making sure no goods are left unsold.
Training sessions
The team performed six online training sessions on subjects of data models, reports, security, version source control, and Power BI FAQs. Our developers recorded short training video instructions and shortcuts for performing different work tasks. We used Confluence to store step-by-step guides, manuals, and other important project documentation.
CI/CD & DevOps
We chose cascade depending pipeline deployments for content connected across pipelines. The principle allows certain pipelines to be deployed before others. The customer uses five workspaces, and when a report is altered, the changes have to be copied throughout the whole flow of workspaces. On top of that, in each new workspace, the report needs to be connected to a dataset in that space. This becomes an issue since up to 150 reports can be changed in five workspaces. Besides, manual deployment of Power BI objects poses several challenges, such as:
- Configuring dataset connections to the gateway manually, which requires file modification
- Configuring reports connections to shared datasets, which also requires file modification
- Tracking what component version of the report has been deployed to each environment
- Tracking compatibility between the deployed database and the Power BI Shared Dataset and Reports
- Managing pipelines from start to finish
- Assigning and unassigning users to and from pipelines manually
- Integrating Power BI into DevOps tools such as Azure DevOps or Bitbucket Actions
- Scheduling automatic pipeline deployments for a given time
- Deploying multiple pipelines at the same time
To avoid the issues mentioned above and allow for faster release of Power BI objects, the team has harnessed GIT Source Control together with DevOps Pipelines.
To set up continuous integration and continuous delivery of content on the project, Itransition used automation tools, including Azure DevOps. They allow developers to leverage the deployment pipelines with the help of Power BI REST APIs and integrate Power BI into the customer’s automation process. So now managing pipelines from start to finish, including creating a pipeline, assigning a workspace to any stage, deploying and deleting the pipeline can be done seamlessly, with minimal manual steps.
At the moment, Itransition’s team has finished testing the automated implementation of delivering reports to workspaces. We are also working on delivering changes to the dataset using CI/CD tools.
Technologies & tools
Itransition delivered the solution using Microsoft Azure services in the table below:
|
Service |
Feature |
Project case |
Result |
|---|---|---|---|
|
Azure Data Factory |
Fully managed serverless ETL service Flexible and scalable Easy to meet the customer’s performance requirements |
Allowed us to abandon using actual servers and subscribe to a pay-as-you-use plan |
Serverless ETL solution with autoscaling and multiple features |
|
Azure SQL Server |
Fully-managed database Automated updates, provisioning, and backups Flexible and responsive Storage quickly adaptable to new requirements Intelligent threat detection Built-in AI |
Common data warehouse for all BI systems, used by other teams No load on the main OLTP system Complete decoupling of the OLTP and OLAP processing |
High availability Peak performance and durability |
|
Azure AD (Active Directory) B2B collaboration
|
Inviting guest users to participate in a controlled and high-security collaboration Securely sharing applications and services Self-service sign-up Creating authentication and authorization policies for corporate content protection Onboarding external partners |
EKO works safely and securely with their external partners, adding guests even if they don't use Azure AD or have a development team |
Secure authentication |
|
Azure DevOps |
Smart planning Seamless collaboration Fast delivery |
Automated deployment pipelines Integrating Power BI into the customer’s automation process |
Automated implementation of reports Automated changes delivery |
Results
As a result of our partnership, we achieved the following results:
- Up to 24x faster data delivery from the OLTP to the OLAP system in under 1 hour
- ~3x dataset size reduction to keep costs the same as in Avora while accessing more features
- Migrating 150+ complicated reports in under 6 months
- Rich visualization capabilities for solving complex business issues

Services
Business intelligence consulting services
Business intelligence consulting services from certified BI providers to help companies define an effective BI strategy and deliver scalable BI solutions.

Insights
BI implementation: a comprehensive roadmap & best practices
Learn what BI implementation entails, including key steps and benefits, along with BI challenges and their solutions to effectively generate insights from data.

Case study
Automation of sensitive data gathering for a non-profit organization
Learn how Itransition delivered a Salesforce-based solution to automate and secure data gathering, significantly streamlining the company’s workflows.

Case study
Cloud business intelligence system for vehicle manufacturers
Find out how Itransition migrated a BI suite to the cloud and delivered brand-new cloud business intelligence tools for the automotive industry.

Case study
BI solution for case study coverage analysis
Read about Itransiiton’s case study and expertise scoring systems that help us easily analyze expertise coverage and pinpoint areas for improvement.

Case study
A dedicated client delivery team for healthcare BI
Learn how we set up a client delivery team to handle change requests, code reviews, and product support, accelerating new feature launches 8 times.

Case study
BI consulting for a CX company
Learn how Itransition optimized Power BI solution and data model for a CX company, achieving 5x faster incremental data loads and saving subscription costs.